 Lap Track Racing
Lap Track app tutorial
Use this guide to load a race file and work through the current Lap Track analysis views, including race-window detection, sectors, elevation, playback, private sharing, and the AI analysis prompt. Your activity file is parsed in the browser and is not uploaded unless you explicitly create a share.
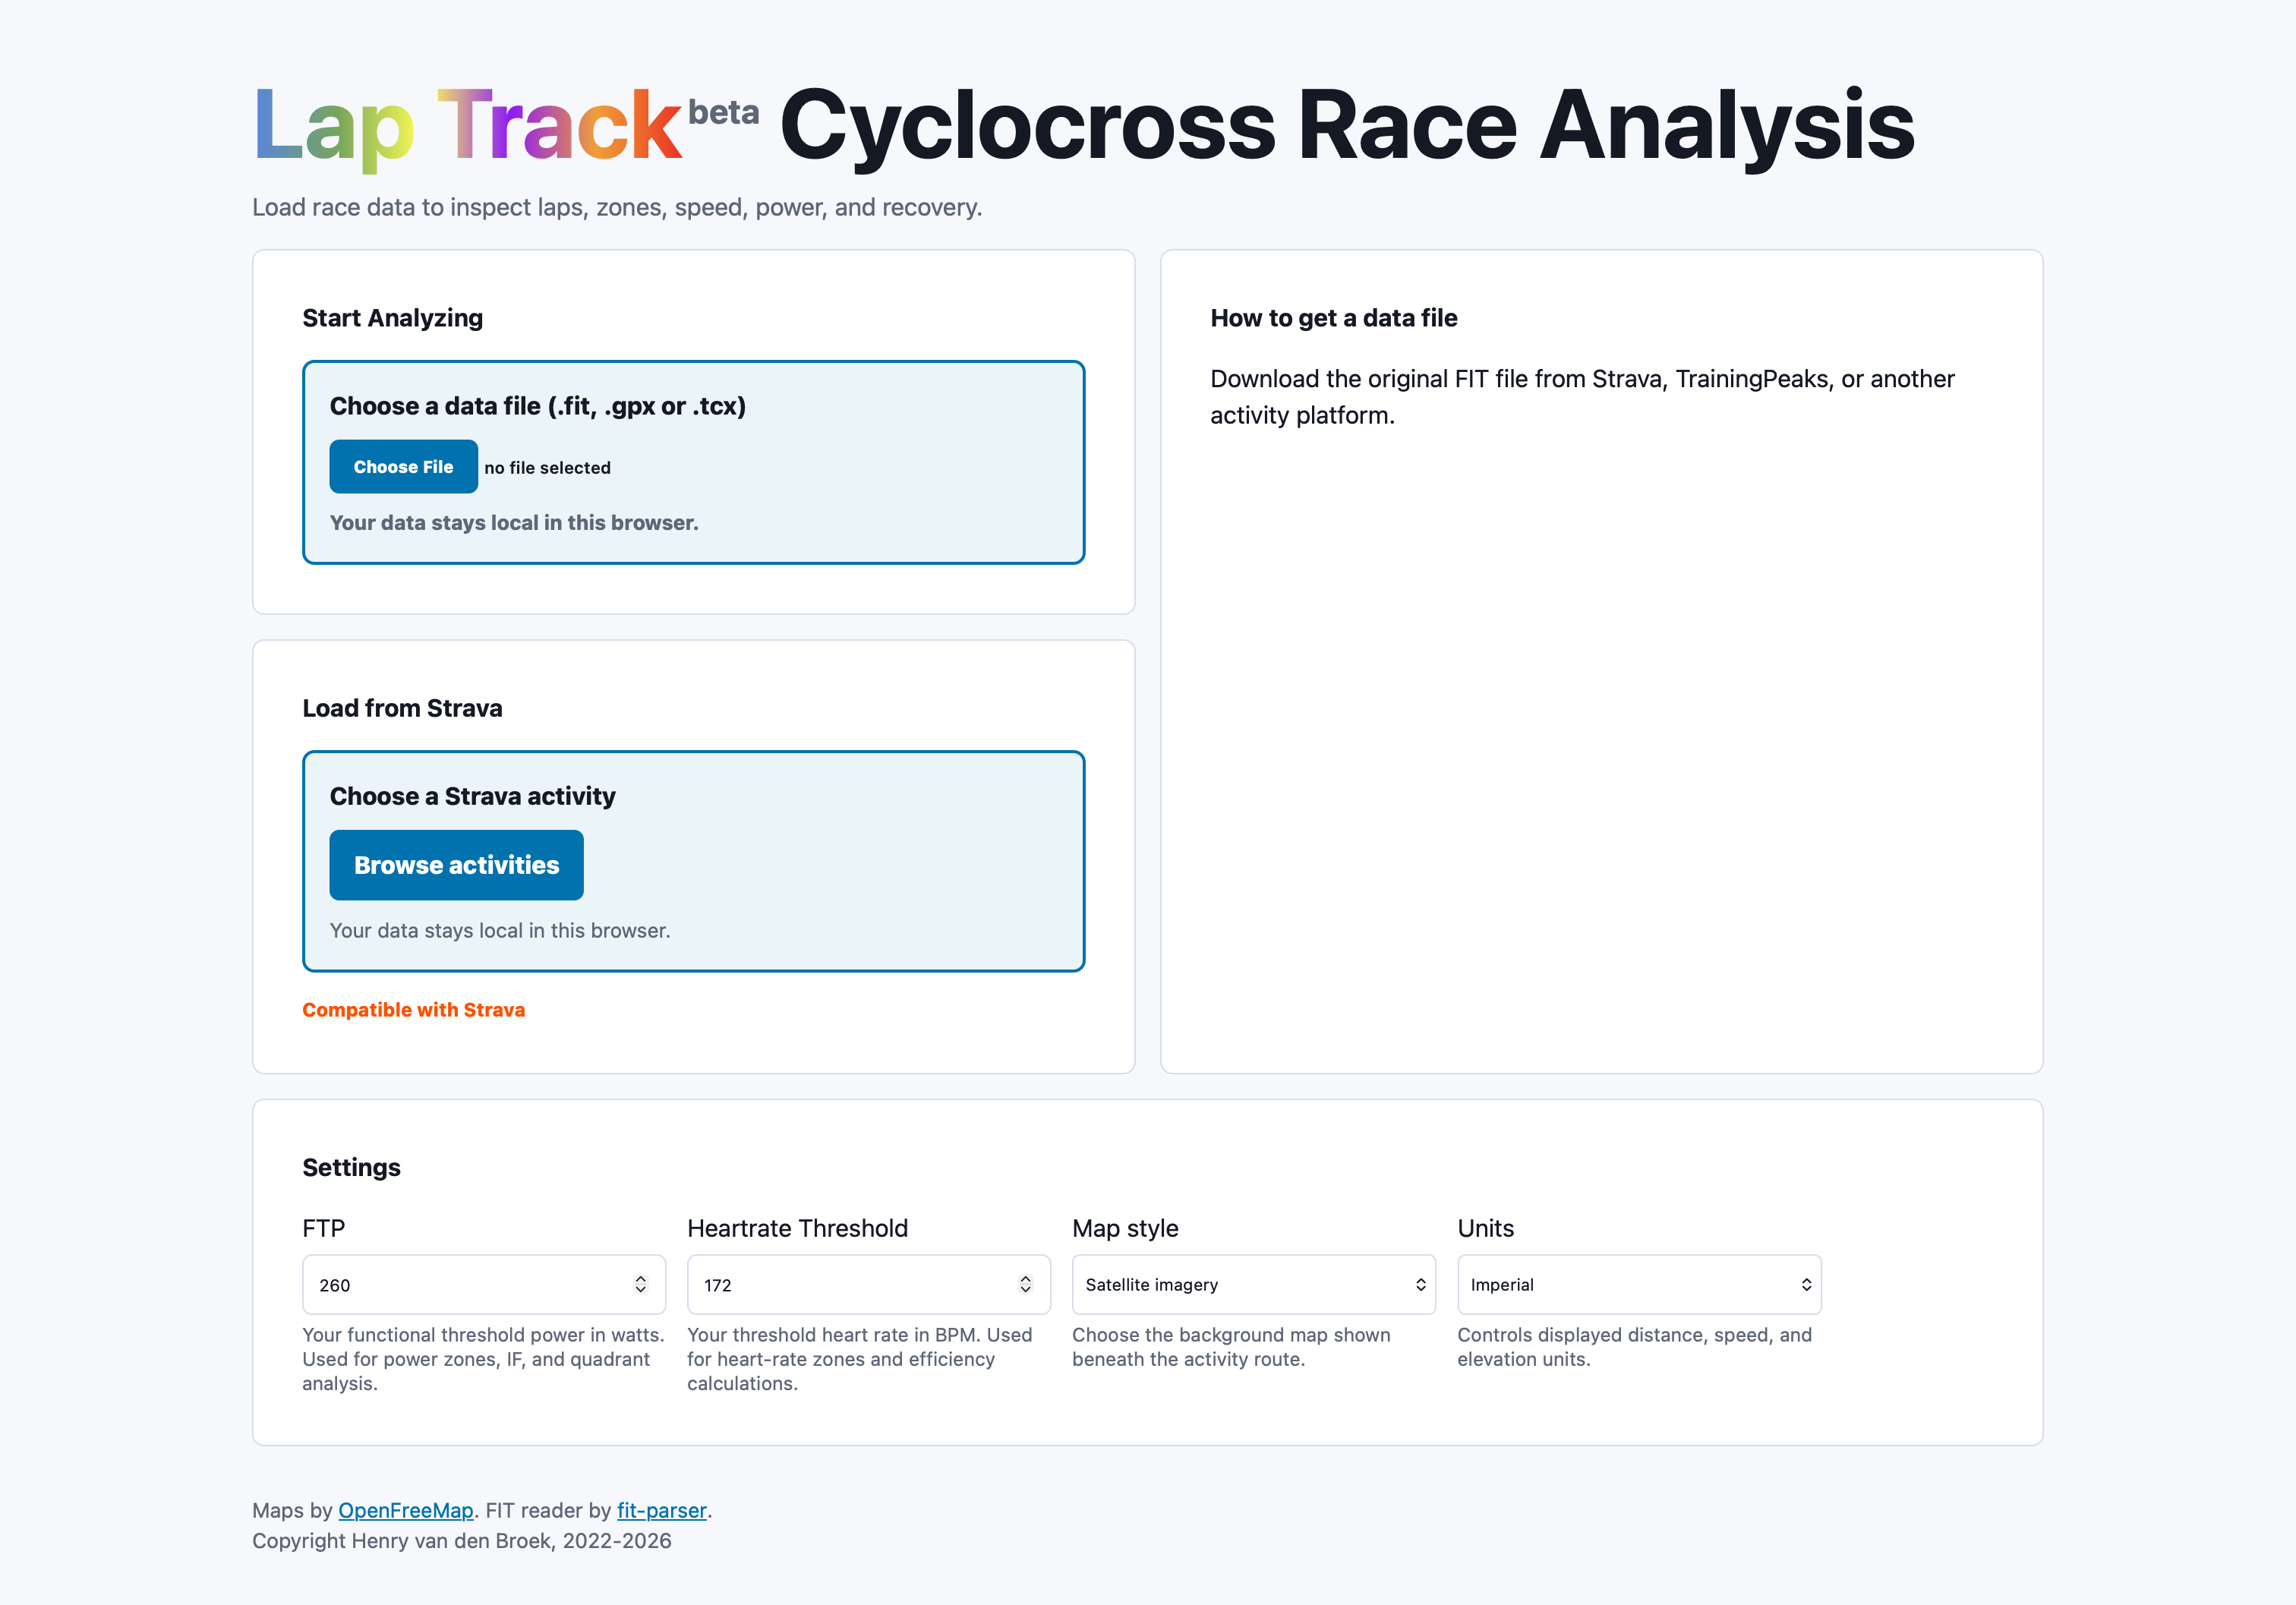
1. Load a race file
- Open the app and select Choose race file.
- Select a FIT, GPX, or TCX file from your computer. The app identifies the sustained race effort, course, start, finish, and laps, even when the file includes recording before or after the race.
- Use the sample file shedpark-2024.fit to try the workflow.
2. Load from Strava

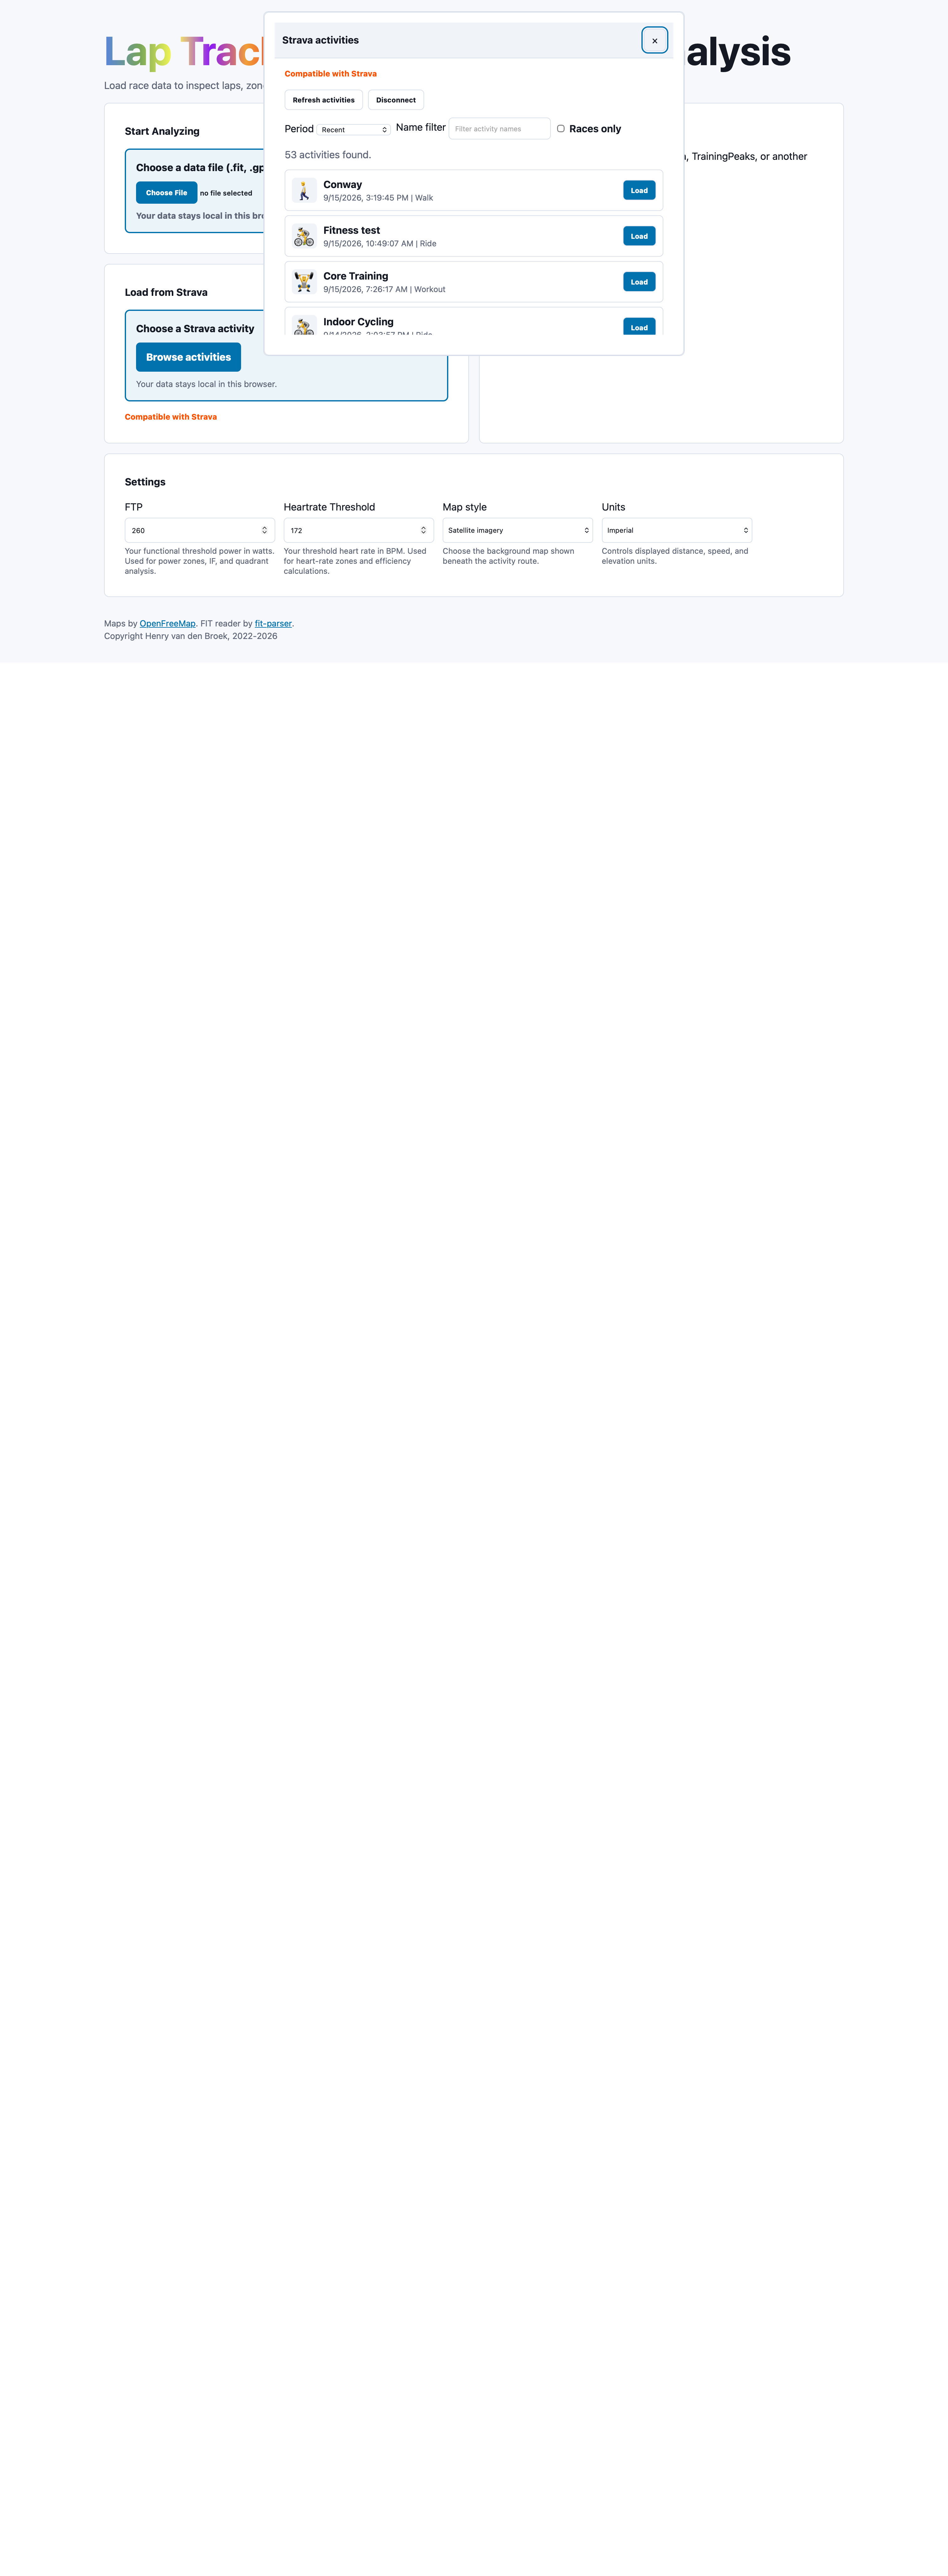
The optional Strava integration lets you browse recent activities or search by time period and title. Open the app’s Load from Strava card, choose a period, optionally filter for races, and select Load on an activity.
Strava access is part of the Lap Track beta. Your Strava activity data is fetched only after you authorize it, and selected activity results are cached temporarily in your browser to make repeated searches faster. You can disconnect Strava from the dialog at any time.
Lap Track protects the owner athlete account and allows other athletes to use the remaining beta connection slots. When the limit is reached, an older non-owner authorization may be revoked to make room for another athlete. If no slot is eligible yet, try again later.
3. Check settings and race tuning
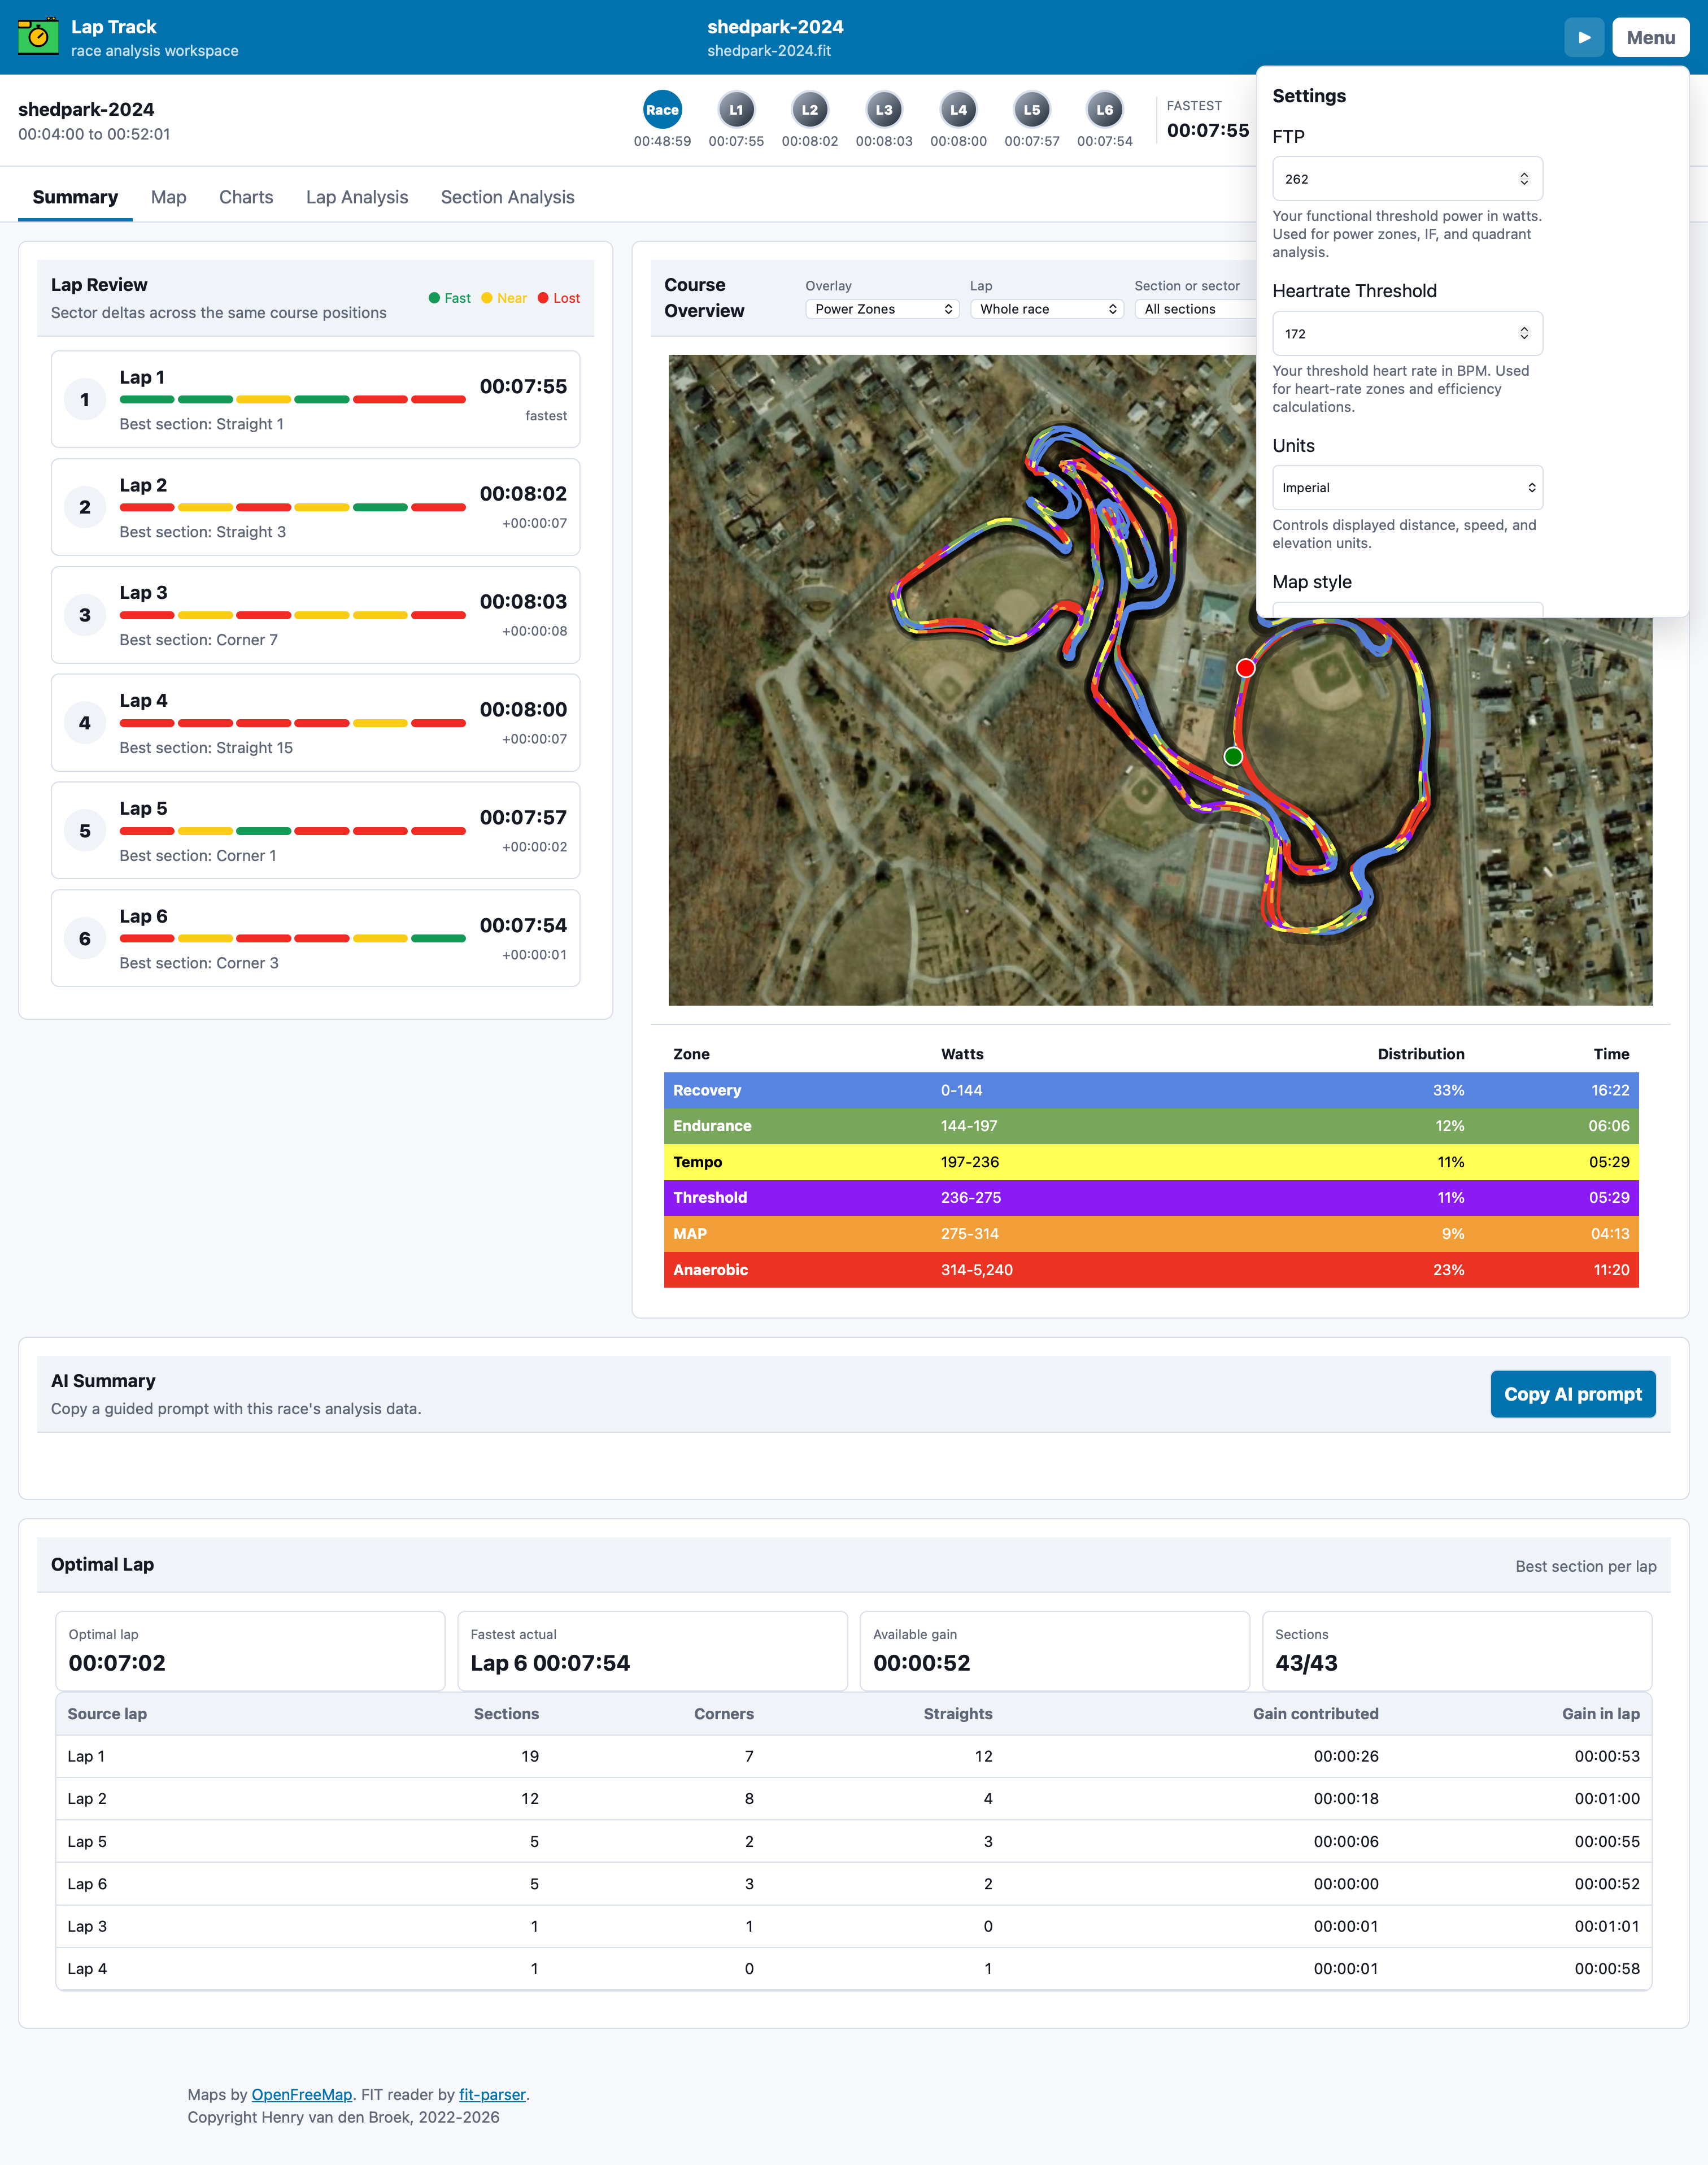
Open Settings from the app menu to set FTP, threshold heart rate, units, and map style. Enable Race & Lap Tuning from the menu when the detected start, finish, lap overlap, or smoothing needs adjustment. It is hidden by default to keep the analysis view focused.
4. Start with the summary
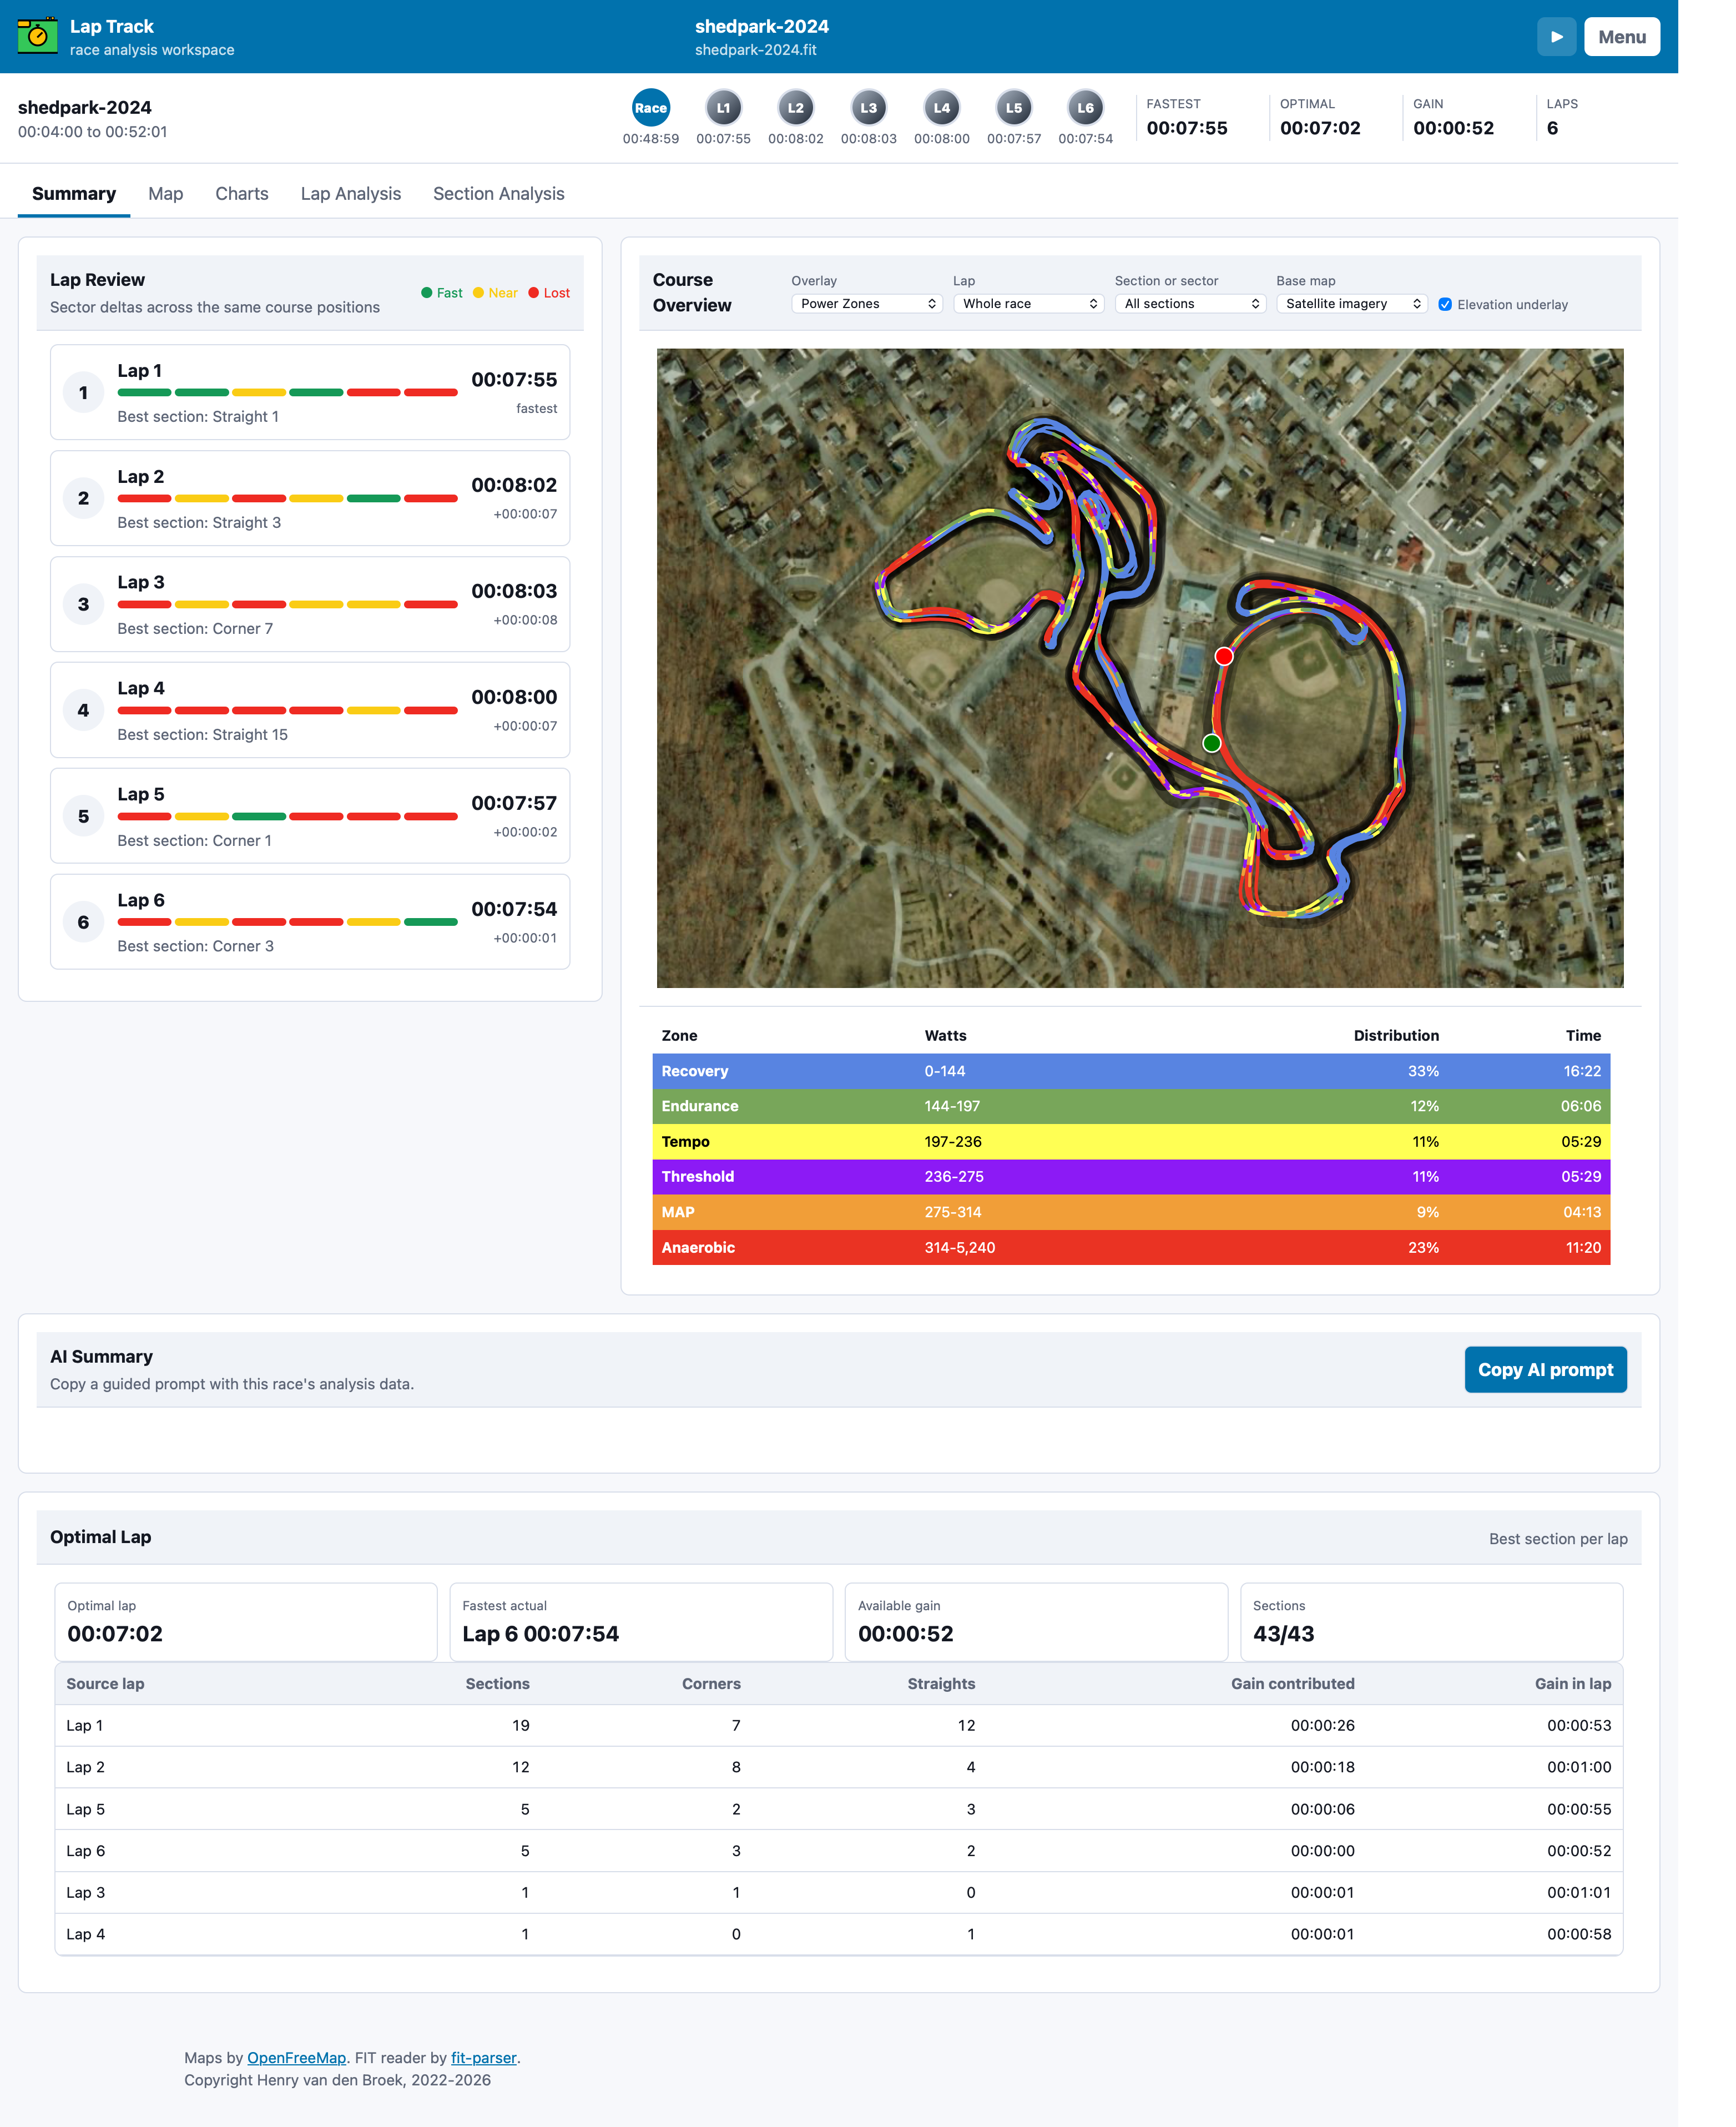
The summary view brings together the course, lap review, optimal lap, and section information. Select a lap from the quick selector or lap table to compare that lap against the rest of the race.
5. Compare multiple activities
After one activity is loaded, use Compare activity in the blue toolbar to add another local FIT, GPX, or TCX file. You can also add a Lap Track private share link or an eligible activity from the Strava dialog. The first activity is the reference course; Lap Track checks GPS route similarity before accepting another activity.
The activity buttons appear in the blue toolbar. Select one activity to return to the normal lap analysis. Select All to replace Lap Review with Activity Review, where matching course sections are classified as Fast, Near, or Lost across activities. The existing lap buttons remain below the activity row and still control whole race, lead-in, and lap selection.
In All mode, the map draws one color-coded route per activity, charts overlay one line per activity, and playback shows a moving dot for each activity. If the routes cannot be matched, Lap Track leaves the reference activity loaded and explains what needs to be corrected.
6. Read the map overlays
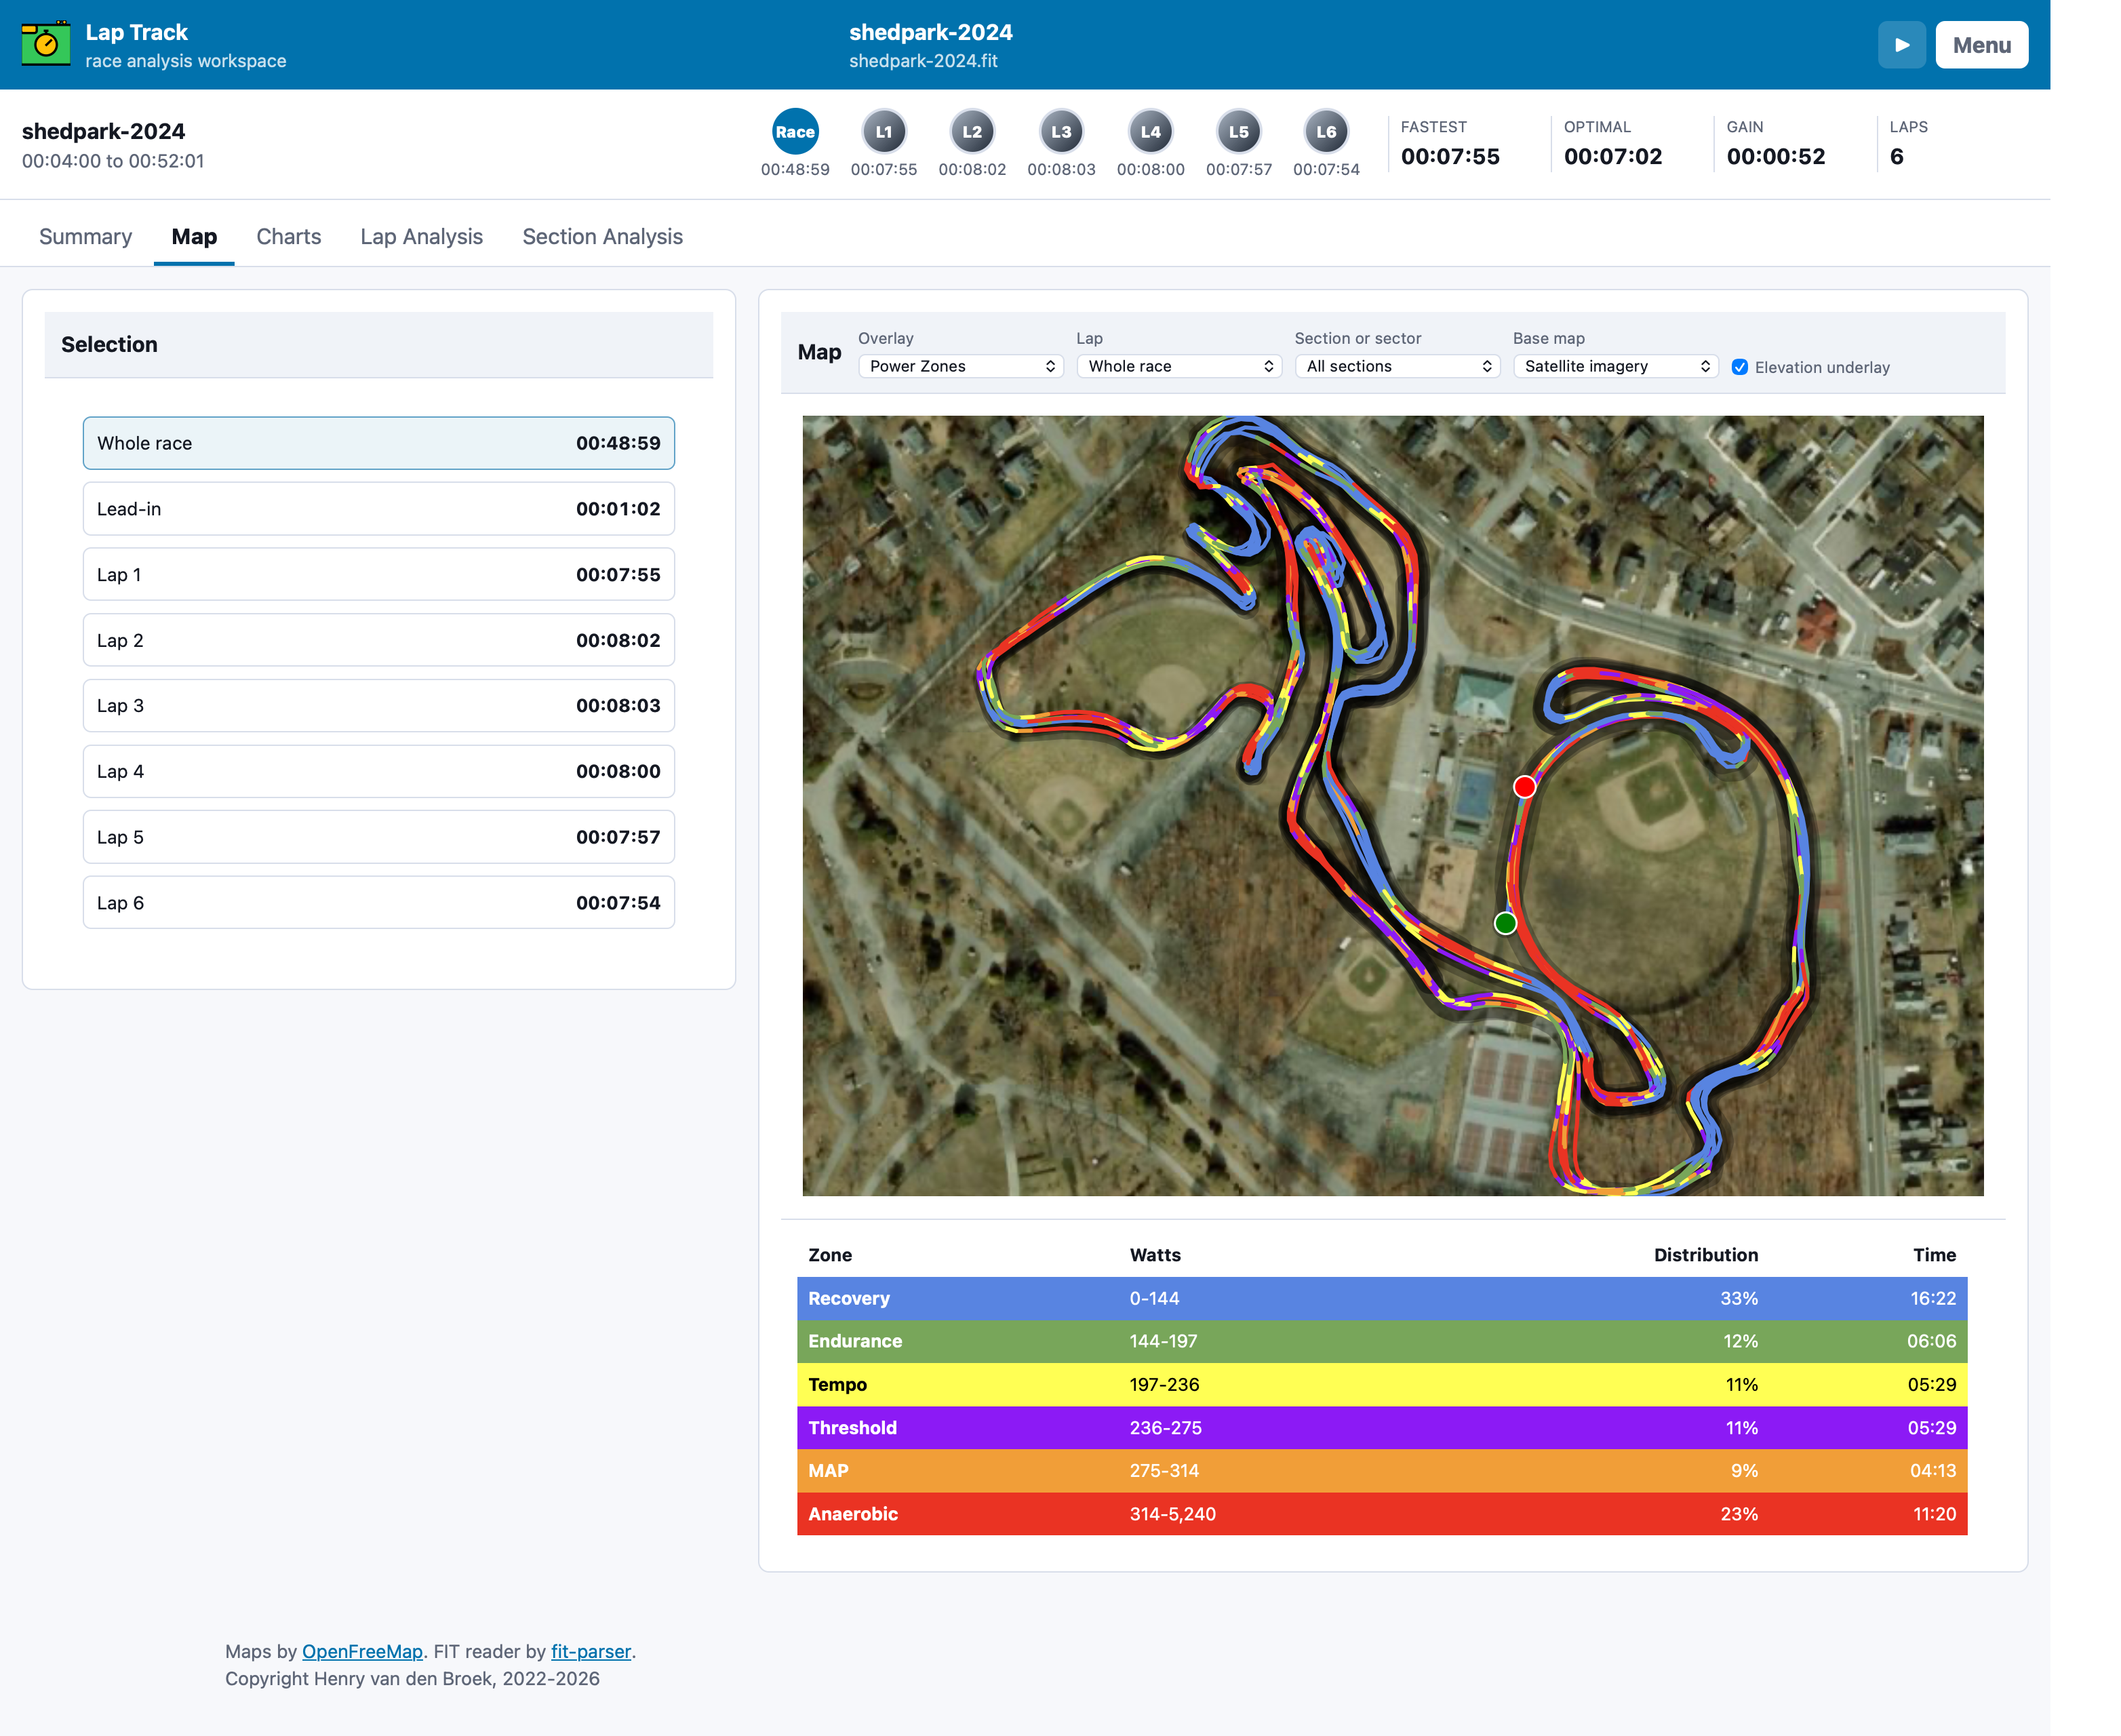
Open the Map view and choose a basemap and overlay. Available overlays depend on the data in the file and can include power zones, heart-rate zones, cadence, speed, grade, elevation, course sections, and quadrant analysis.
Use the lap and section-or-sector selector to change the highlighted data. The zone legend reports both percentage and time distribution for the current race or lap. Elevation bands are relative to the selected course range, while the optional elevation underlay uses a grayscale relief treatment.
7. Compare sectors and sections
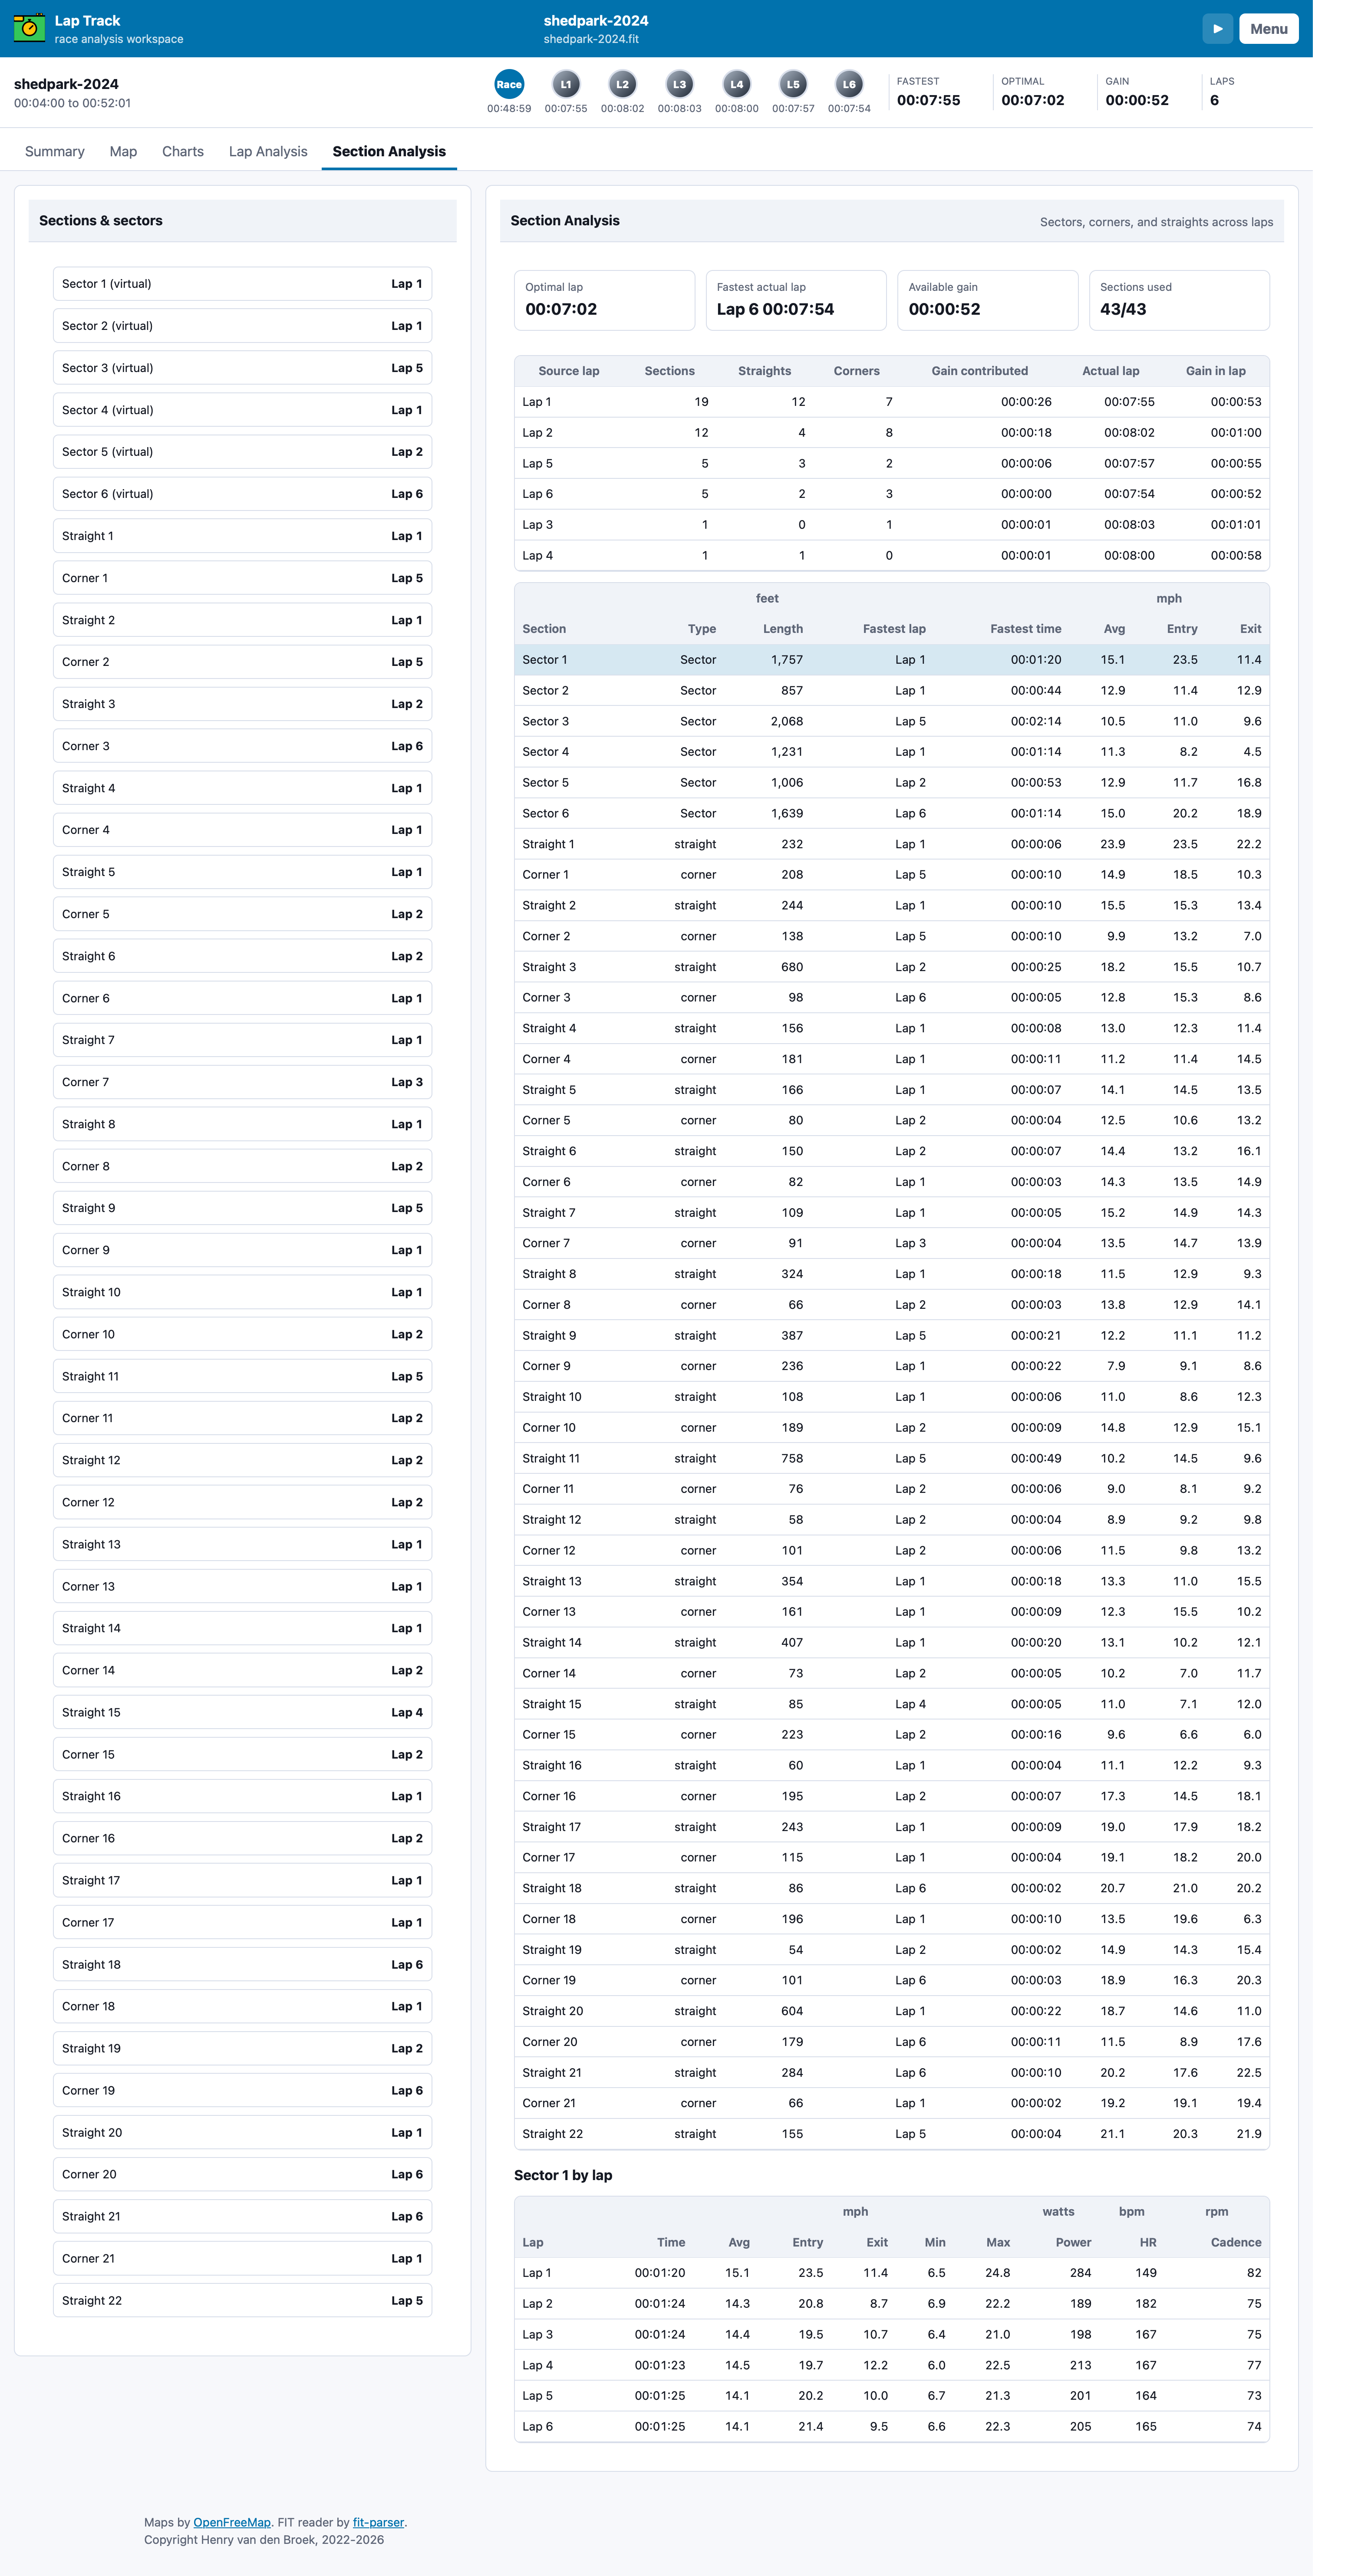
The Lap Review strip divides the detected course sections into six consistent location-based sectors. These are not time percentages: Sector 1 represents the same course portion on every lap. Click a sector strip segment or choose it from the Section or sector selector to highlight the grouped ranges on the map.
Section Analysis lists the virtual sectors first, followed by the individual corners and straights. Each row can be compared across laps using elapsed time, speed, power, heart rate, cadence, and elevation.
8. Compare charts
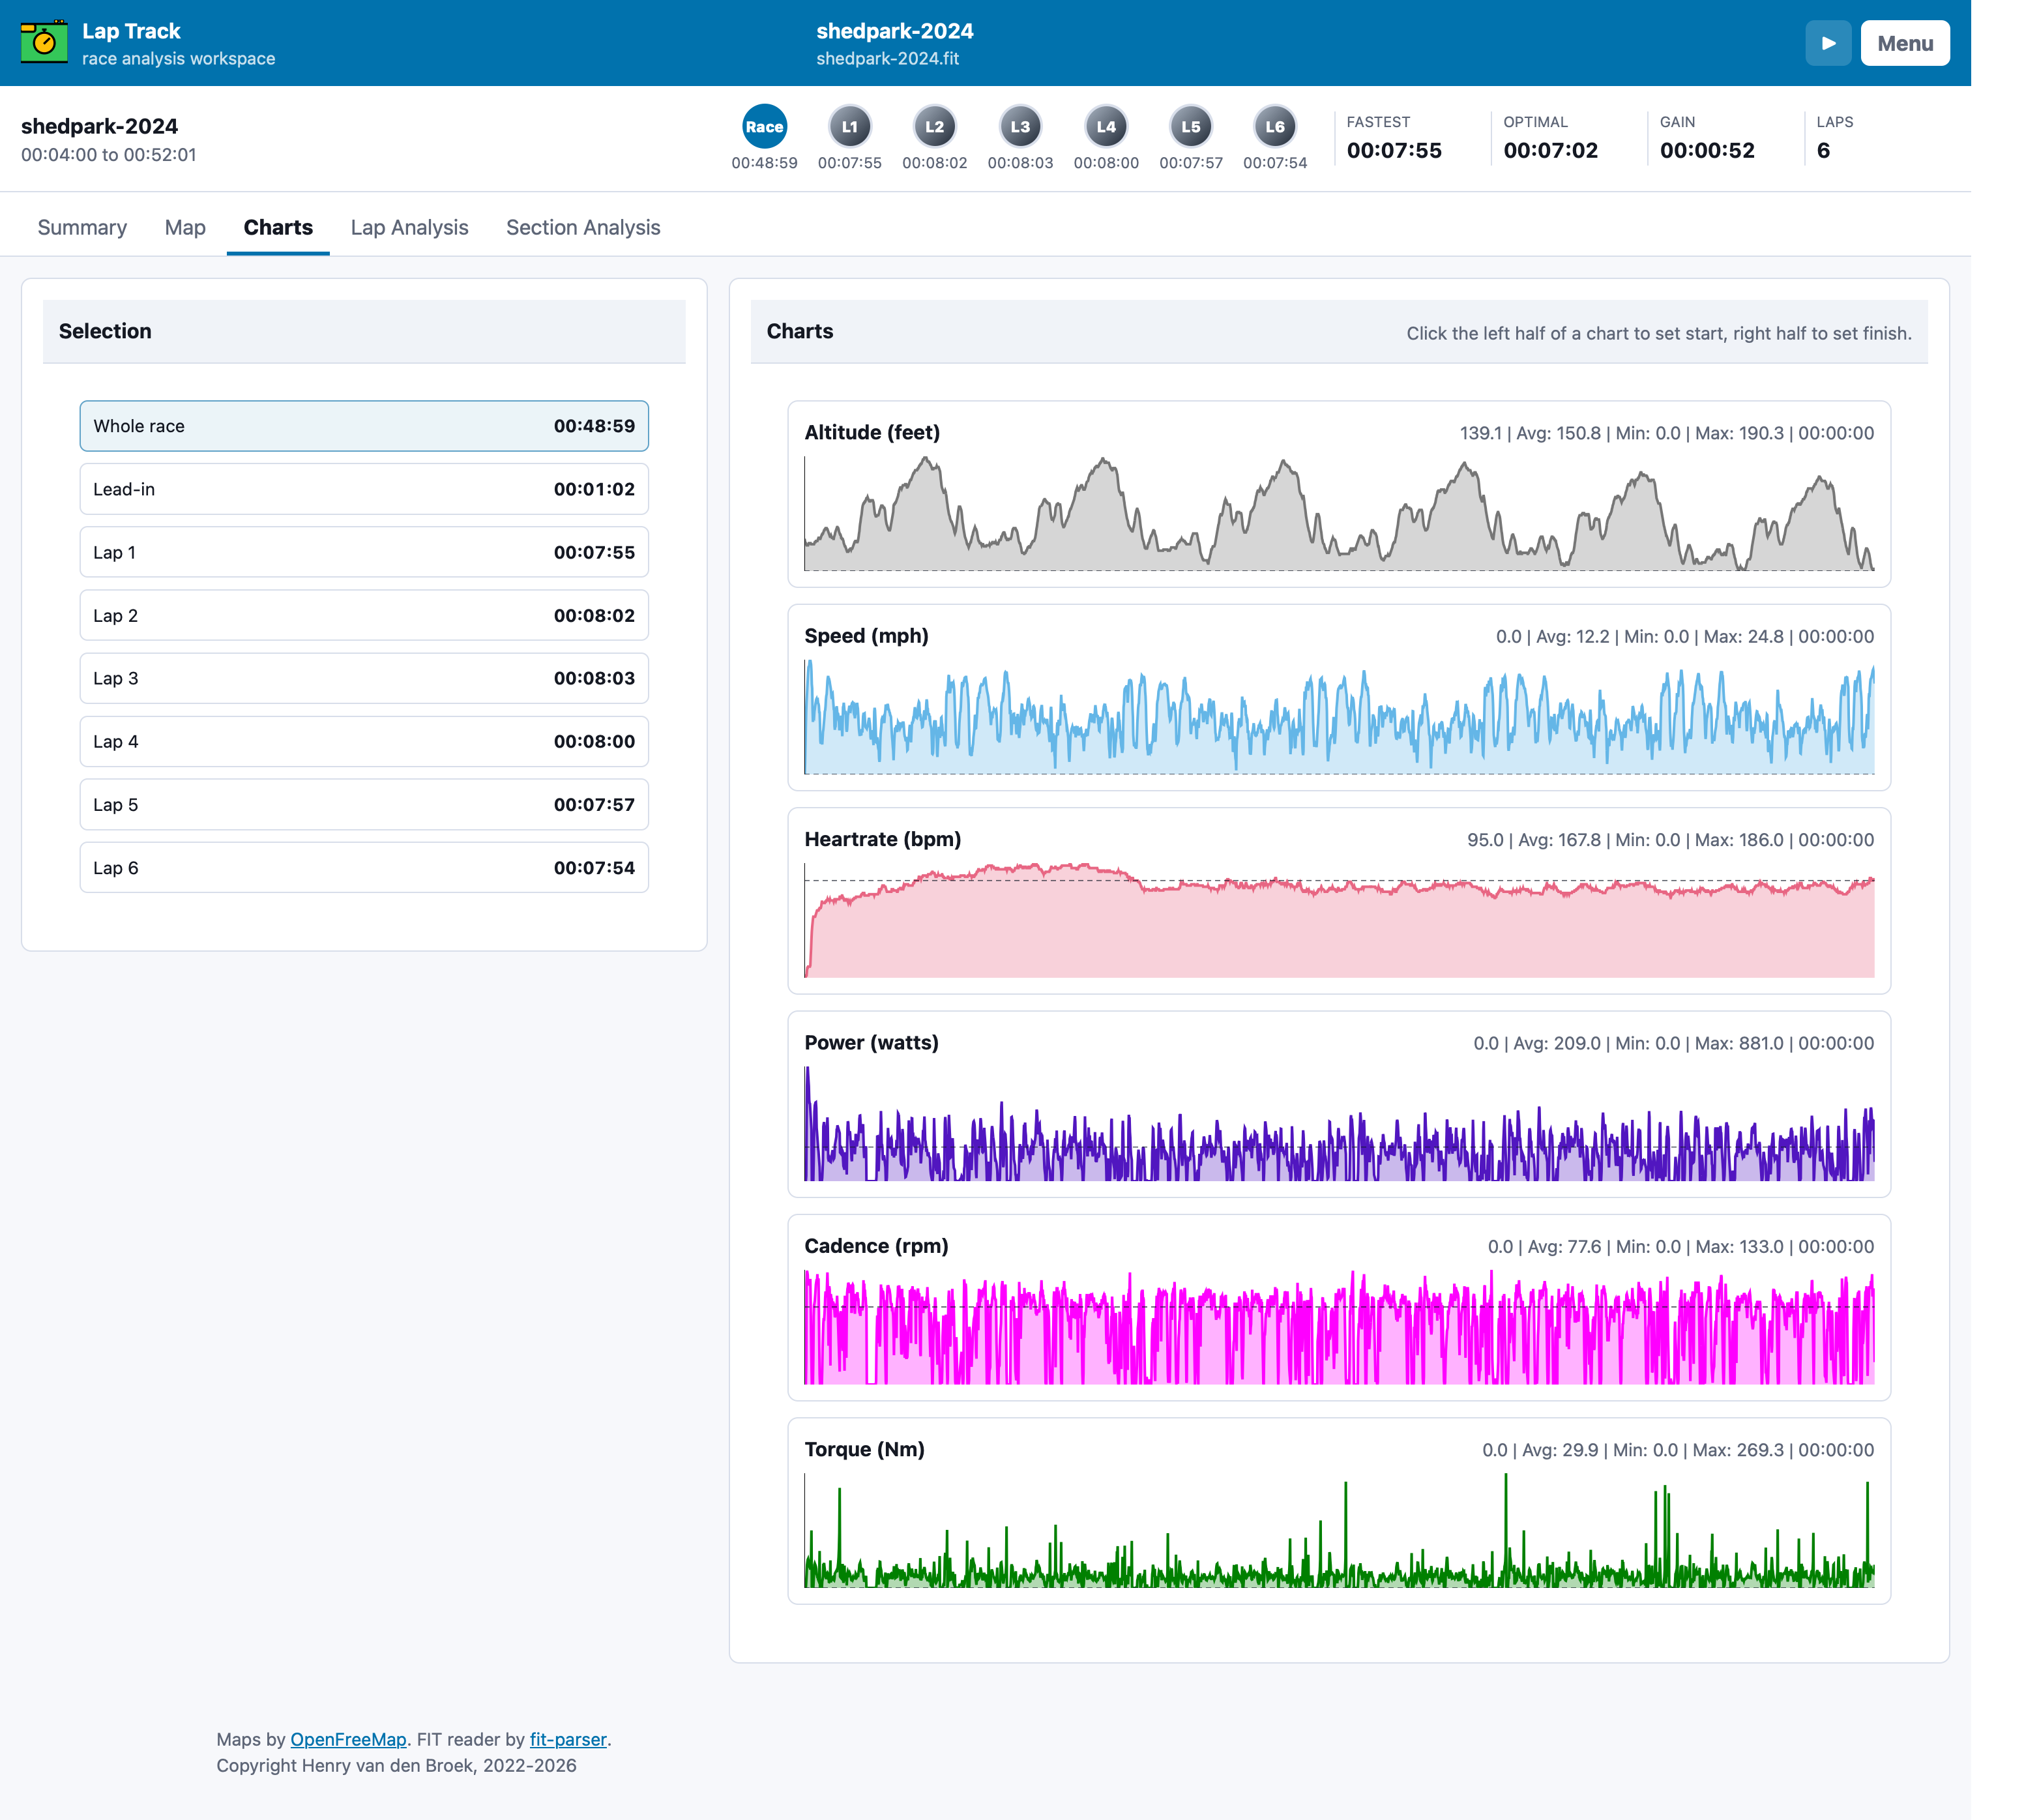
The Charts view keeps the charts synchronized. Hover over a chart to move the shared vertical datapoint marker across all charts and the map. Reference lines identify FTP in the power chart, threshold heart rate in the heart-rate chart, and 90 rpm in the cadence chart.
9. Use playback
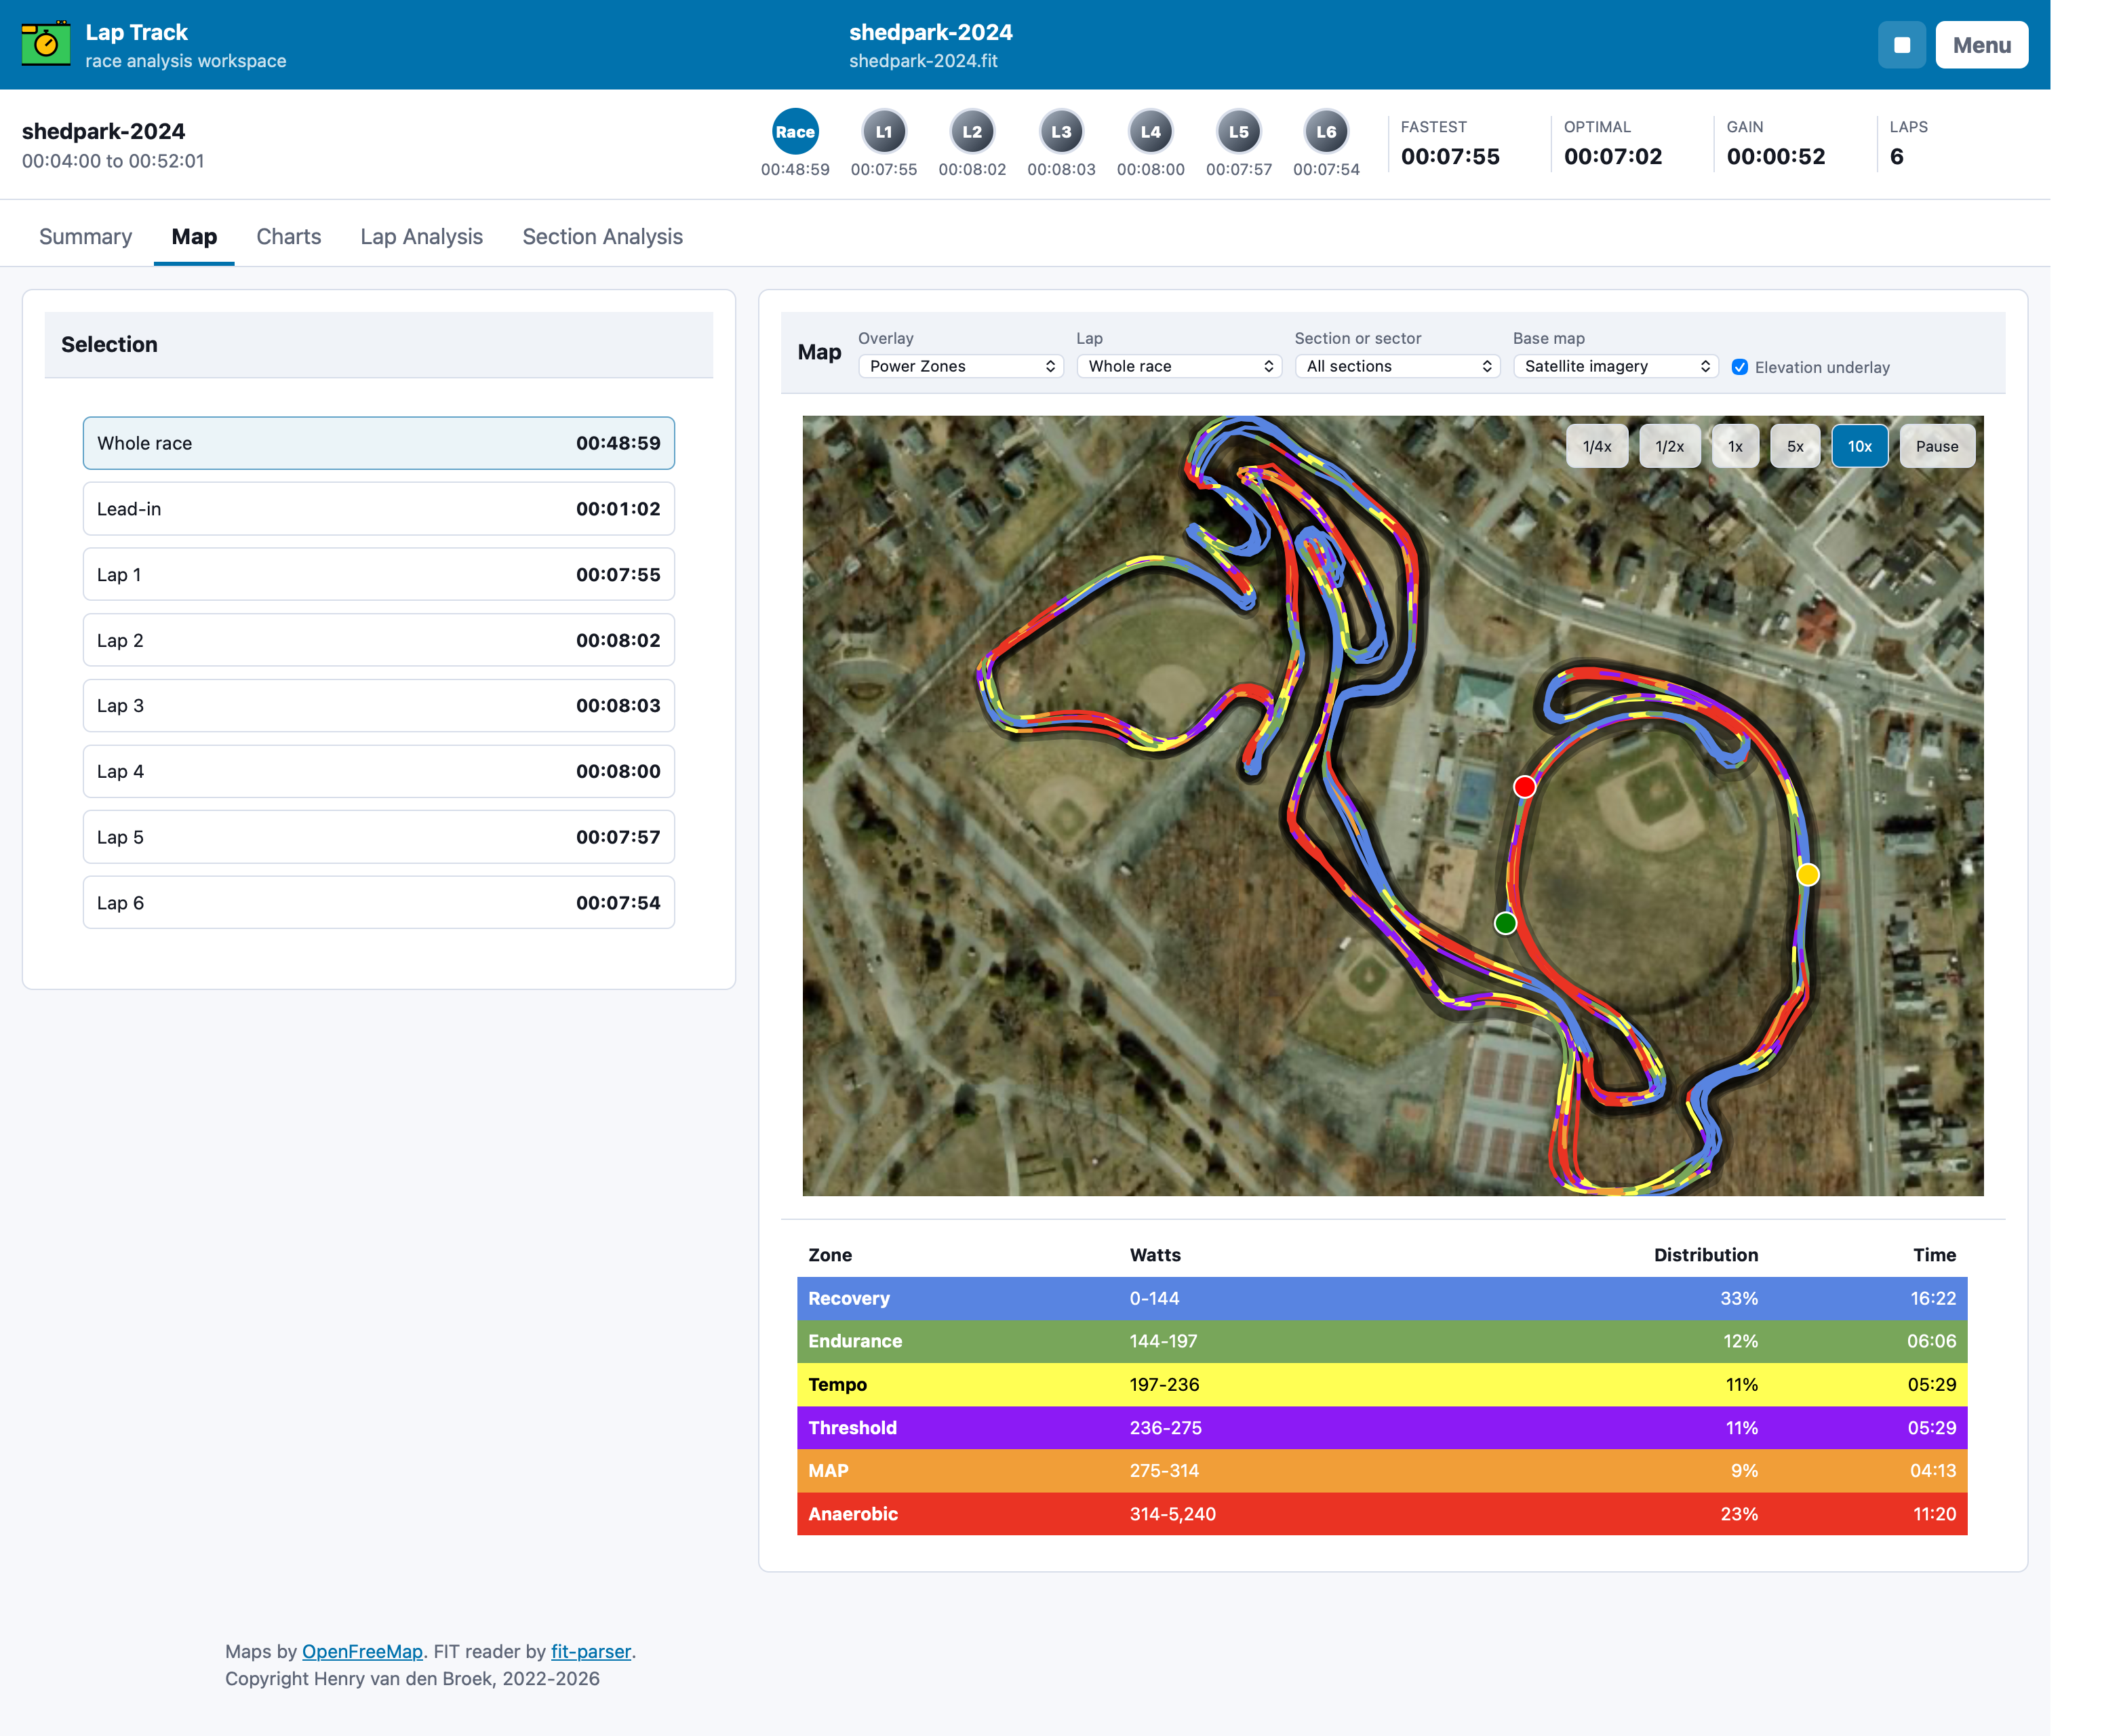
Select the play control in the menu to start playback. Playback controls appear as a transparent map overlay. Pause keeps the yellow position marker visible; changing the speed updates the playback rate without rebuilding the map or charts. The map overlay can also show lap racers, the fastest lap, and the optimal lap. Click their legend entries to toggle them.
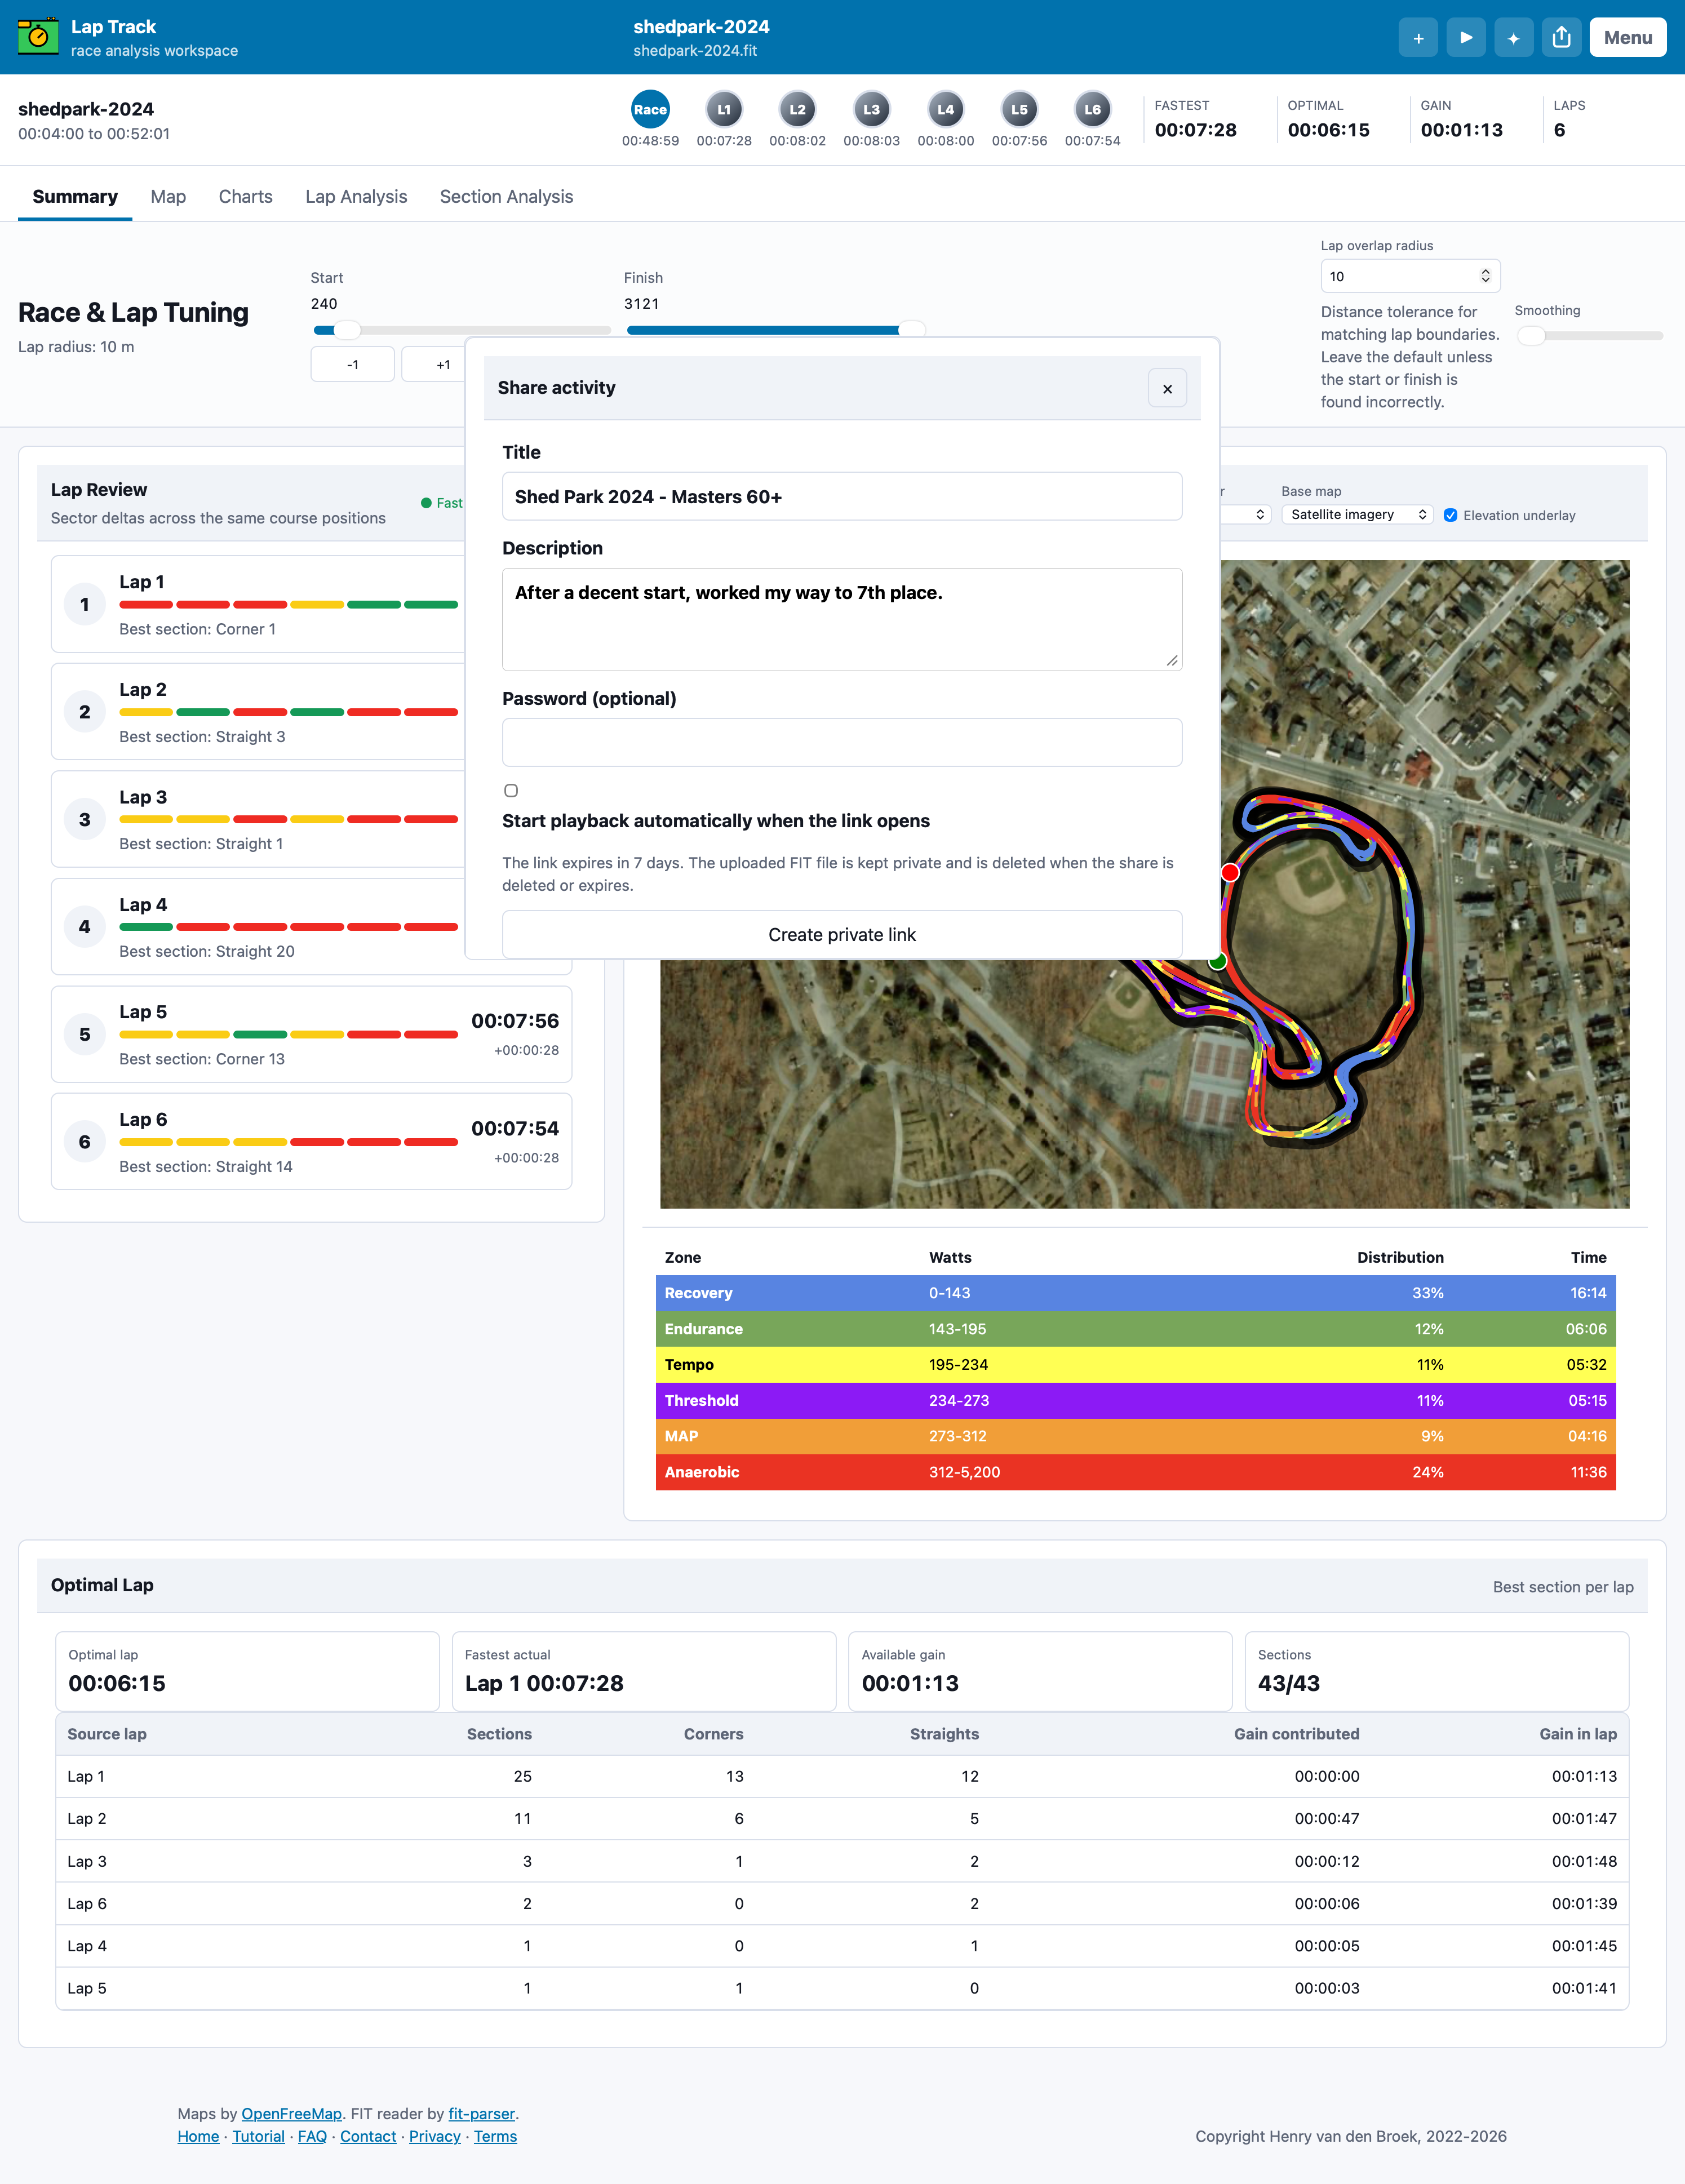
10. Share an analysis
For a locally loaded FIT, GPX, TCX, or RaceBox CSV activity, select the share icon in the navigation. Add a title and optional description, choose a link duration of 7, 30, or 90 days, then optionally set a password. Lap Track uploads the activity file to its private share storage only when you create the link. The shared analysis is read-only while still allowing the viewer to start a new activity.
You can enable Start playback automatically when the link opens to make the shared race begin playing after the activity finishes loading. The share dialog lists active links so you can copy them again or delete them early. Strava-loaded activities cannot be shared directly; download the original FIT file or an available GPX/TCX export from Strava, load it locally, and then create the shared link.
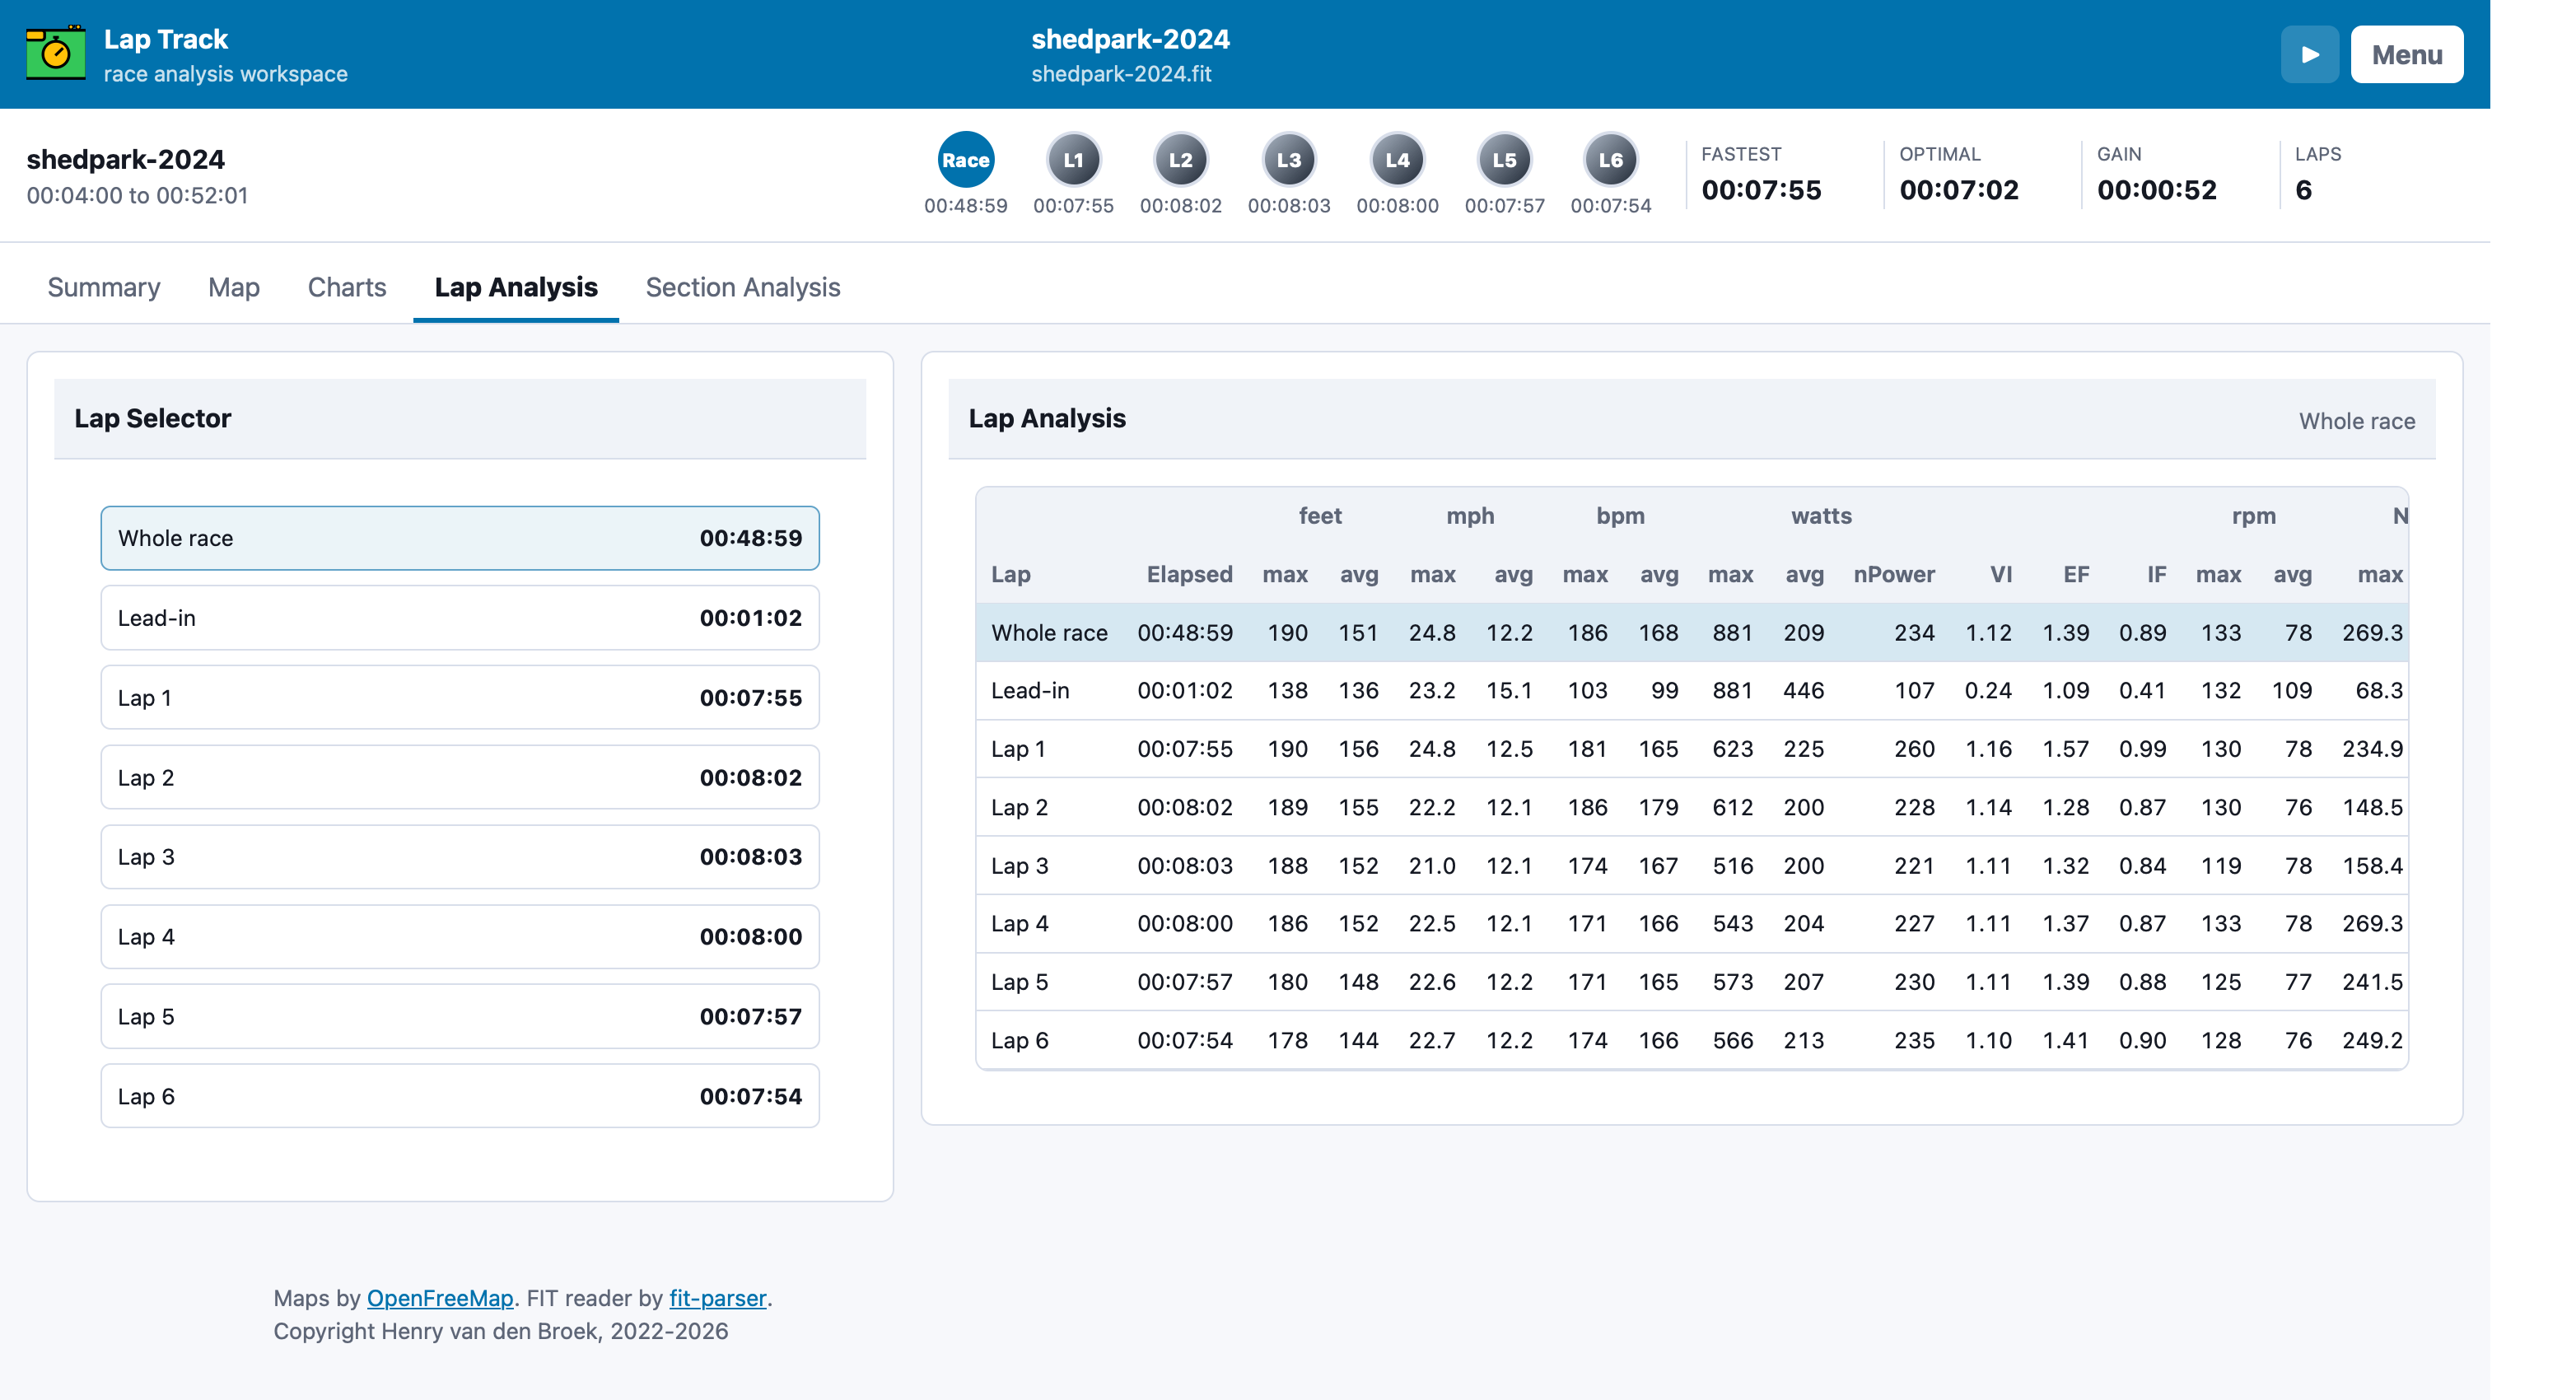
11. Review laps and course sections
Use Lap Analysis to compare elapsed time, speed, heart rate, power, normalized power, variability index, efficiency factor, and intensity factor. Use Section Analysis to compare the same course positions across laps and identify where time was gained or lost.
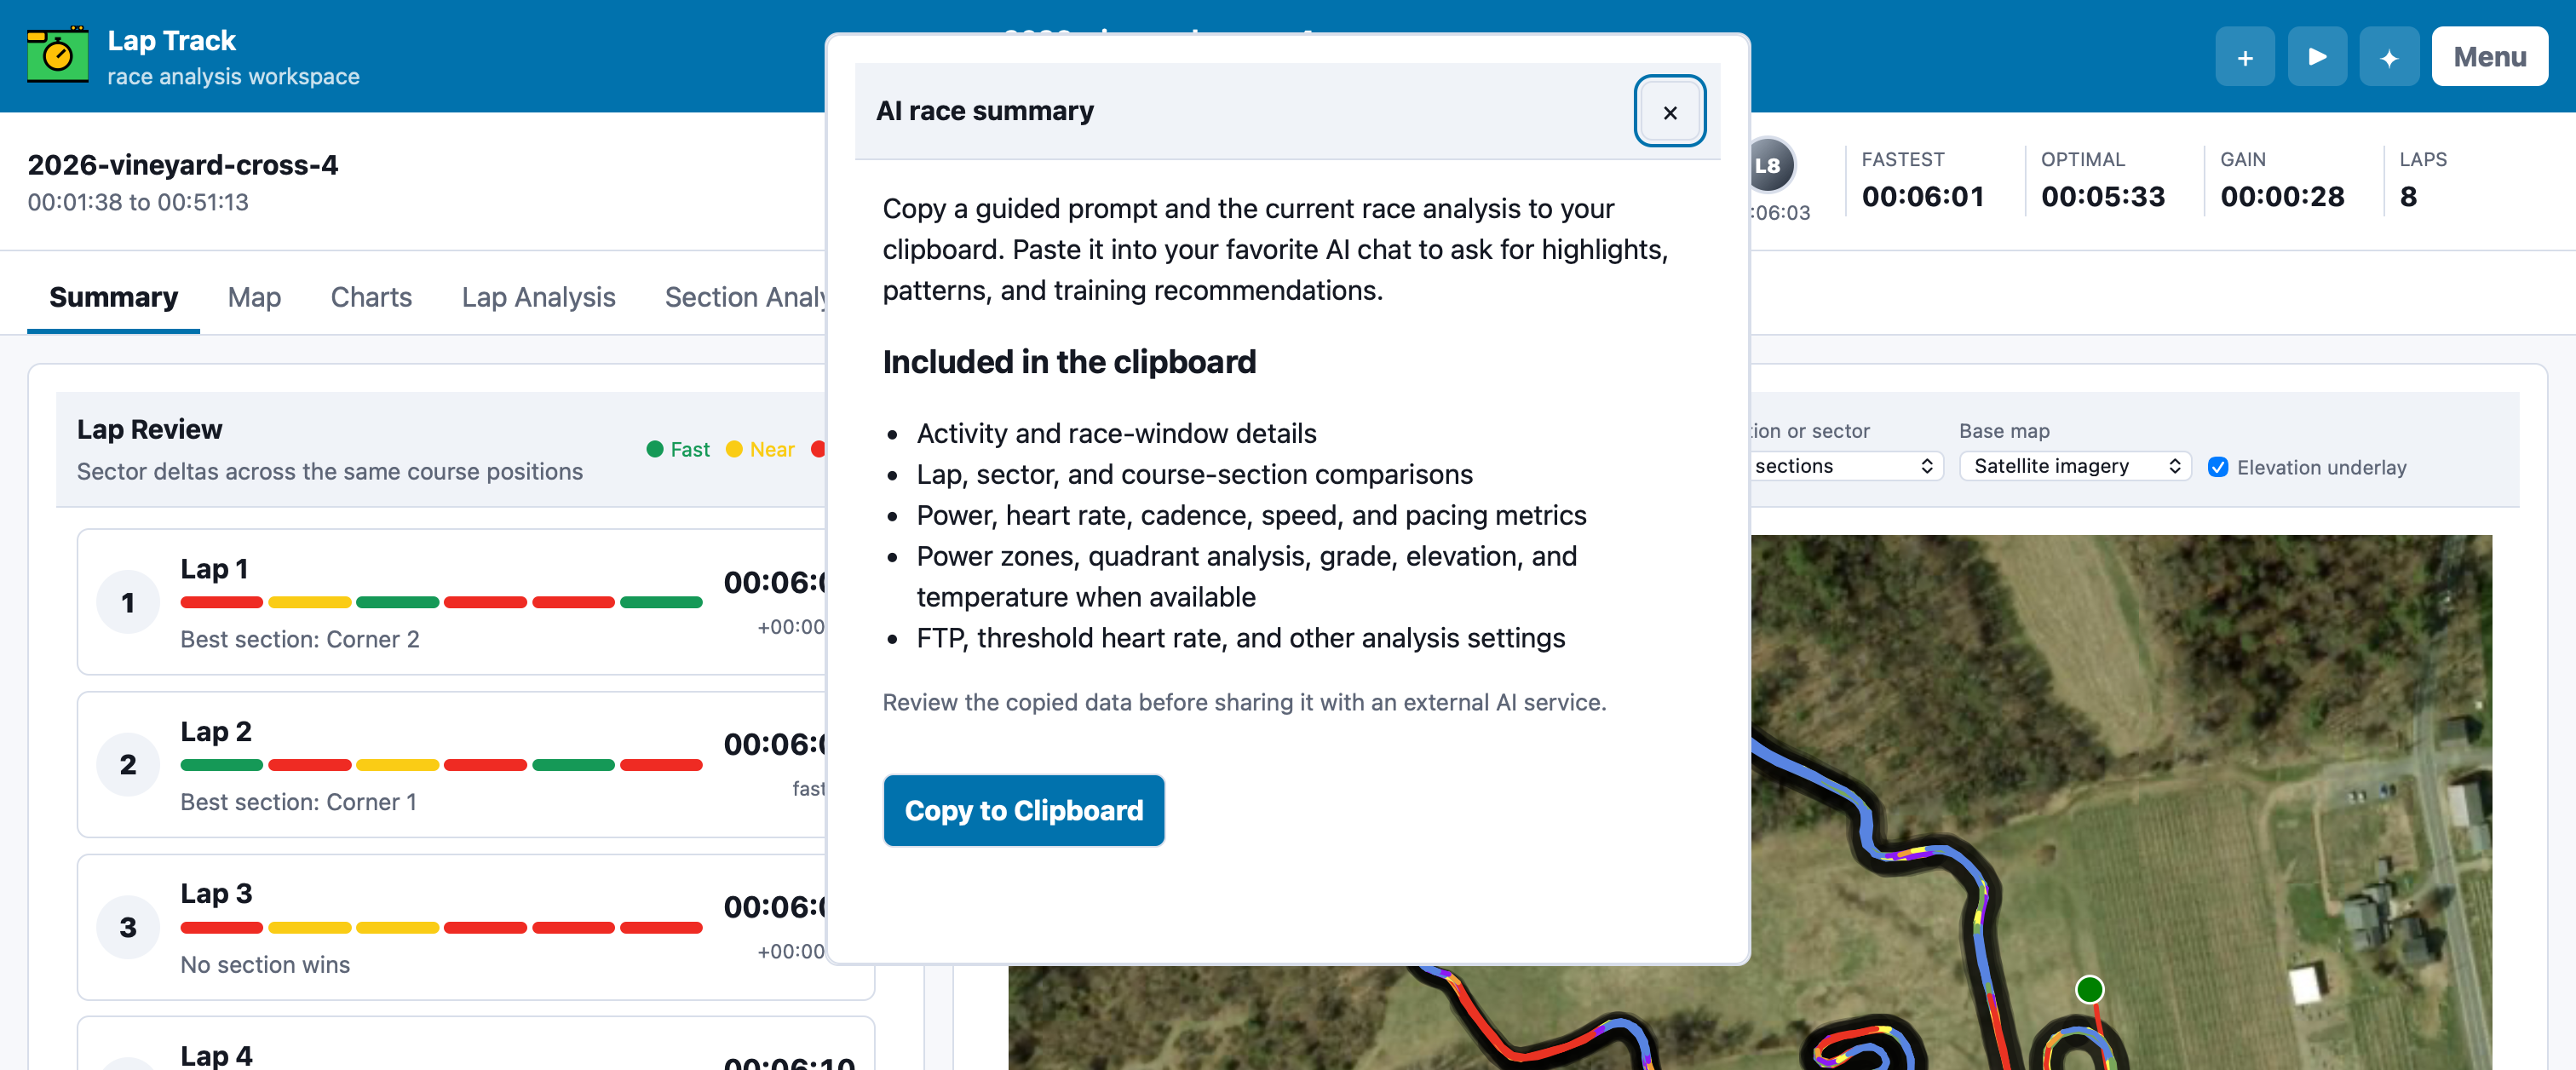
12. Prepare an AI summary
For locally loaded FIT, GPX, or TCX files, select the sparkly AI button in the navigation and choose Copy to Clipboard in the dialog to place a guided prompt and the current analysis JSON on the clipboard. This export is not available for Strava-loaded activities; download the original activity file from Strava and load it directly first. The payload includes lap metrics, section and sector comparisons, zone distributions, entry, exit, minimum, and maximum elevation for each section and sector, plus whole-race and per-lap temperature statistics when the source file contains temperature data. Paste it into your preferred AI assistant for a coaching summary, highlights, opportunities, and recommendations.
0 for the whole race, 1 through the available lap numbers for individual laps, and l for the lead-in. Use the arrow keys to move through datapoints.